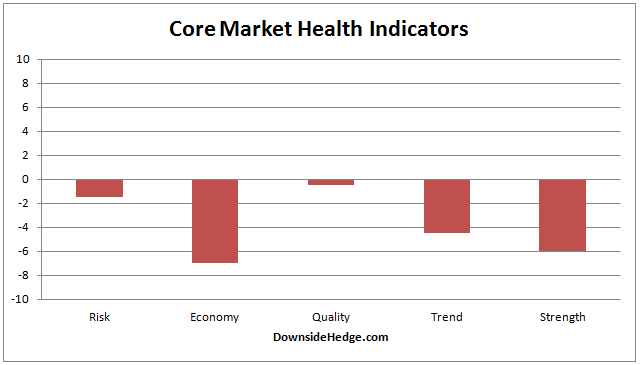
Over the past week my measures of market health bounced around with some gaining and others falling. Most notably, measures of market quality fell below zero. This changes the core portfolio allocations to the following.
Long/Cash portfolio: 100% cash.
Long/Short portfolio 50% long stocks that I believe will outperform in and uptrend — 50% short the S&P 500 Index (using SH or a short of SPY.

My market risk indicator is still reluctant to warn. The two least sensitive components have flat lined over the past several weeks. They have been moving slightly just above or below zero. The most sensitive components are are compressing in a range well above zero. This leaves the volatility hedged portfolio 100% long.
Basically, the market is on dangerous underpinnings, but price hasn’t broken down. My market risk indicator is telling us that market participants are waiting for a price break before getting concerned.
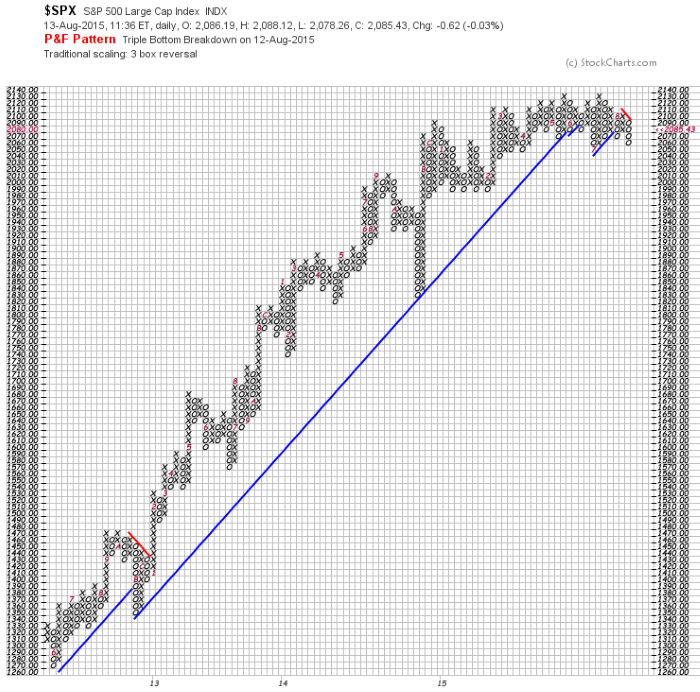
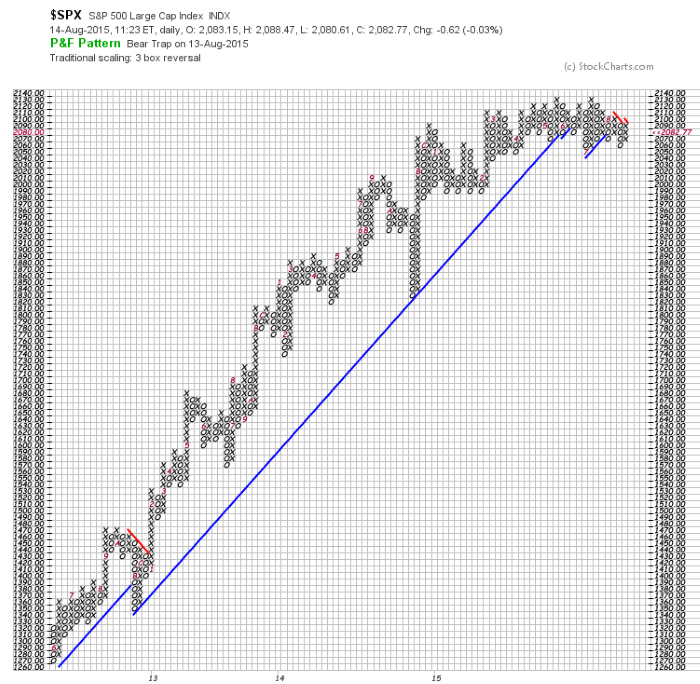
The indexes are painting patterns that can be either accumulation or distribution. They are best characterized as trendless. A great example of the lack of trend comes from a point and figure chart of the S&P 500 Index (SPX). On Thursday it was painting a triple bottom breakdown. Then on Friday it painted a bear trap.
Conclusion
We’ve got a trendless market with weak internals. The lack of a price breakdown is keeping risk at a moderately high level, but far from panic. It’s a time for caution. If price on SPX breaks below 2040 it will be a time for extreme concern.

