Upcoming US Events for Today:- PMI Services for April will be released at 9:45am. The market expects 55.3, consistent with the previous report.
- ISM Non-Manufacturing Index for April will be released at 10:00am. The market expects 54.2 versus 53.1 previous.
Upcoming International Events for Today:
- Euro-Zone Investor Confidence for May will be released at 4:30am EST. The market expects 14.2 versus 14.1 previous.
- Euro-Zone PPI for March will be released at 5:00am EST. The market expects a year-over-year decline of 1.7%, consistent with the previous report.
The Markets
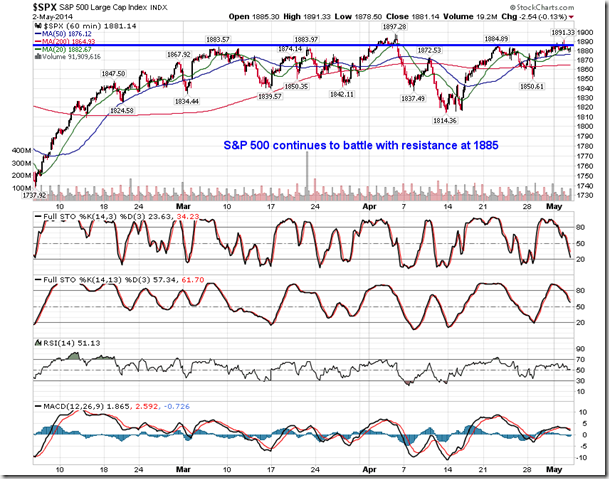
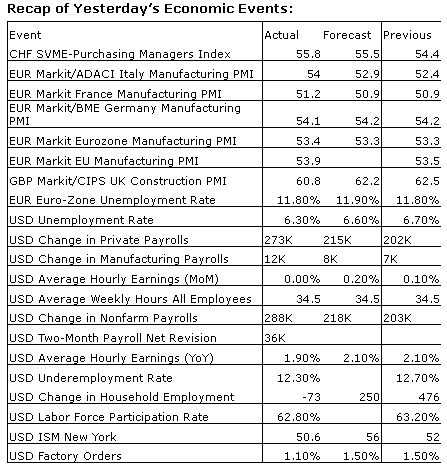
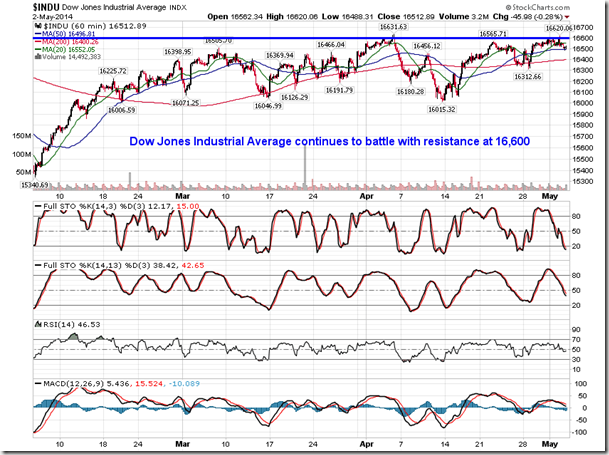
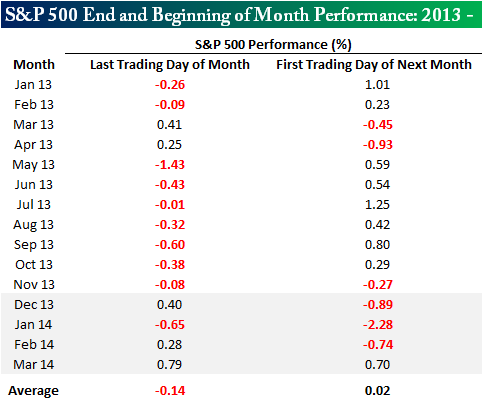
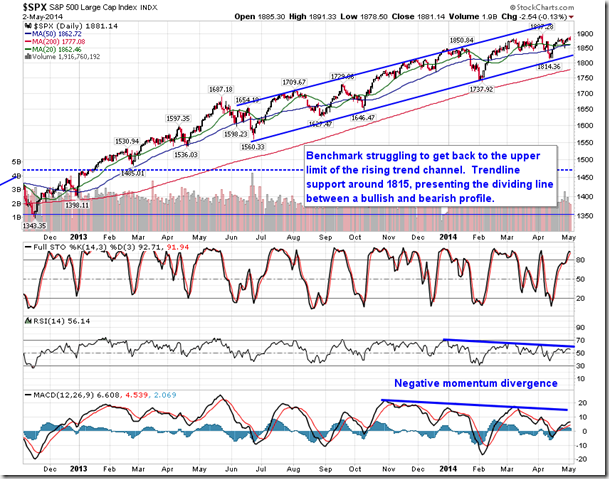
Stocks ended lower on Friday despite a much stronger than expected employment report for the month of April. Non-Farm Payrolls are indicated to have increased by 288,000 for the month of April, well above expectations of 218,000 and the fastest job growth in over two years. The S&P 500 Index and Dow Jones Industrials Average remained stagnant around resistance of 1885, and 16,600, respectively, despite the typically positive tendencies for the first trading day(s) of the month. Bespoke Investment Group notes that stocks have tended to decline on the first trading day of the month since 2014 began, reversing a trend of gains that was common in 2013. Assets typically flow into funds at the start of the month as fund managers put money to work. The fact that this tendency has failed to be realized this year could be further indication of the lack of interest that money managers have in present equity prices. Stocks have been little changed this year in the midst of geopolitical concerns and monetary policy uncertainties.
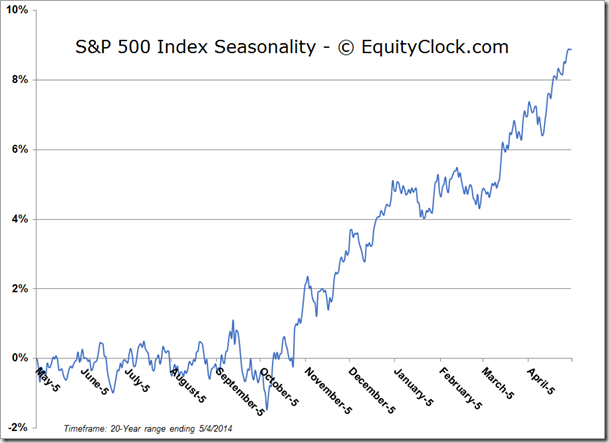
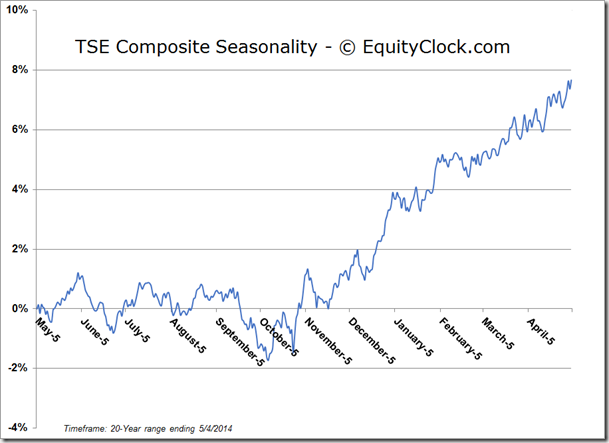
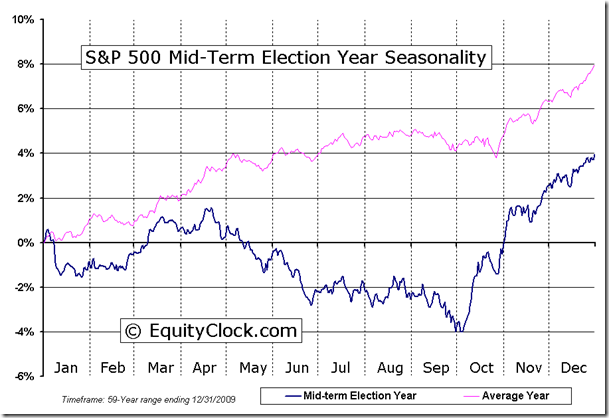
Today is May 5th, the average date of the seasonal peak in equity market that concludes the strong 6-month period for stocks; broad equity benchmarks generally trade flat to negative, on average, between now and October. As of the end of April, a $10,000 portfolio that followed the strategy of buying the S&P 500 Index on October 28th and selling on May 5th beginning in 1950 would now have a value of $1,051,264. In contrast, a $10,000 portfolio starting in 1950 would have decreased to $9,978 if an investor purchased the Index each year on May 5th and sold the Index on October 28th. Commission costs and dividends were not included in the calculation. The propensity for the market to gain over this period is attributed to a series of annual recurring events, including earnings reports, investor meetings, conferences, holidays, economic data, and weather. This sell in May date is receiving much discussion amongst investors once again this year as speculation of a market peak garners debate amidst stagnating equity prices. Chances are higher than average that a summer swoon is realized this year. Mid-term election years, such as this one, present a unique scenario. The S&P 500 has averaged a decline of 4.79% between the end of April and the end of September of mid-term election years dating back to 1950. As well, 10 of the past 16 mid-term election years have recorded a decline of 10% or more at some point during the spring or summer months. As always, investors should use a combination of technical and fundamental analysis in conjunction with a seasonal strategy in order to fine tune investment decisions.
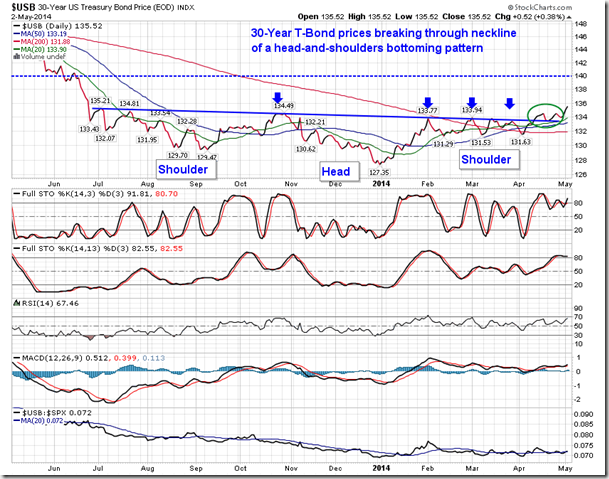
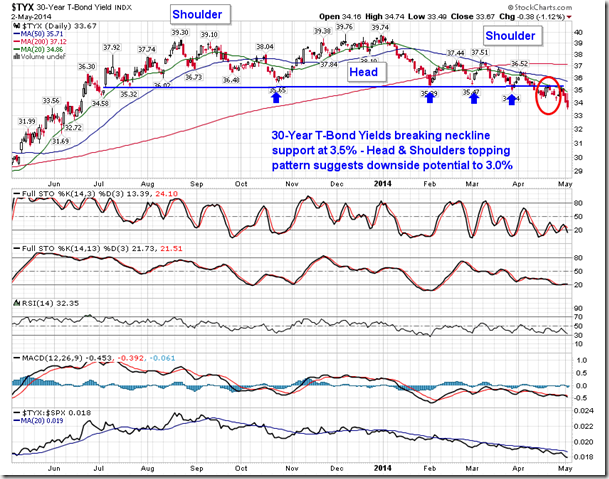
The saying goes “Sell in May and Go Away,” however, opportunities continue to exist through the summer months. In fact, investors that didn’t “Go Away” were able to stay ahead of the buy-and-hold return of the equity market by holding assets that perform well during the typical summer volatility. Defensive sectors, including Health Care, Utilities, and Consumer Staples, tend chart gains through the summer months, in part due to the yields that these sectors offer. Bonds also tend to perform well during the summer months, once again as a result of the desire for yield during the summer volatility. The 30-year Treasury Bond is already well underway to recording these typical summer gains. The yield on the 30-year bond broke below the neckline of a head-and-shoulders topping pattern in the middle of April, trading lower from a high of nearly 4.0% by the end of 2013. Target of the head-and-shoulders topping pattern points to 3.0%; as yields move lower, prices rise. Bond prices seasonally gain and outperform stocks through to October.
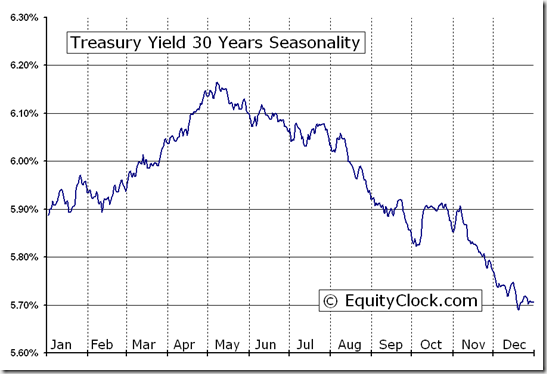
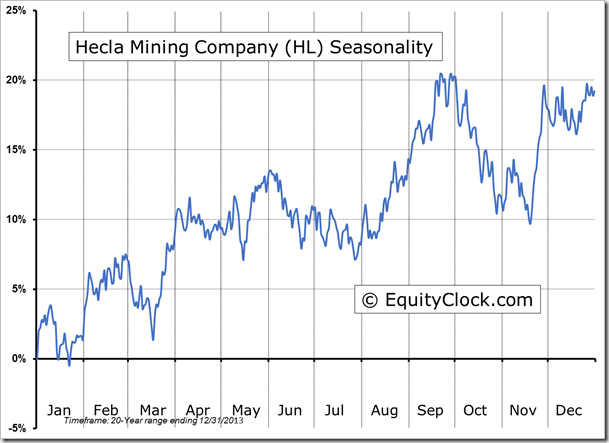
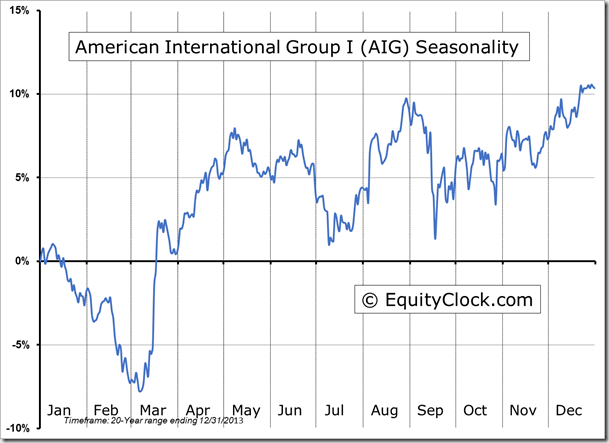
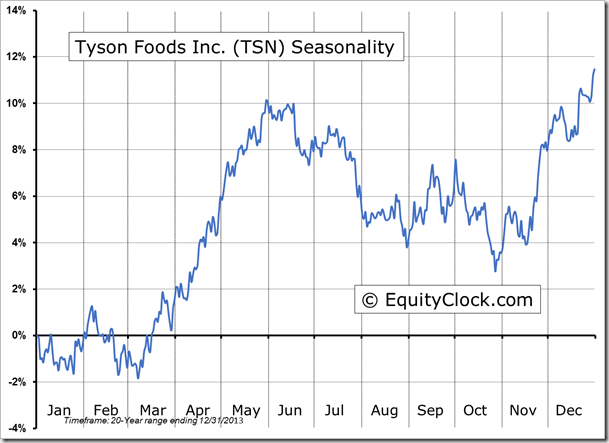
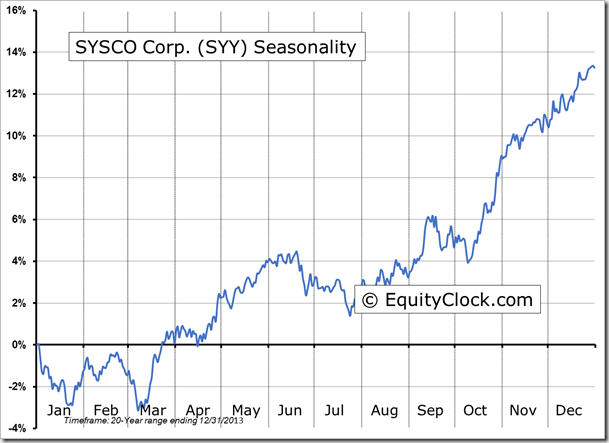
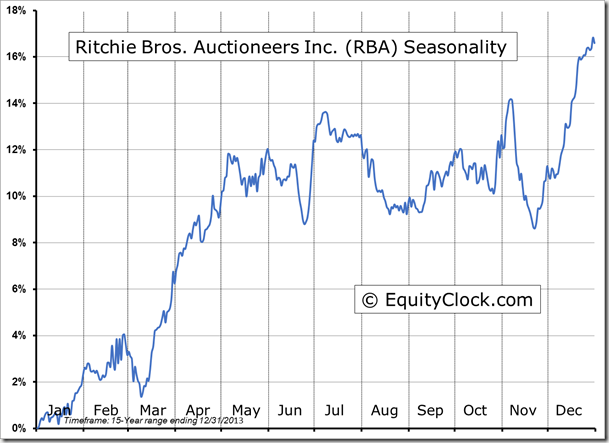
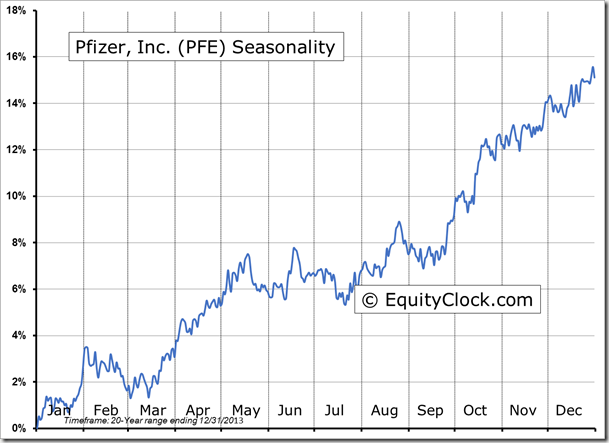
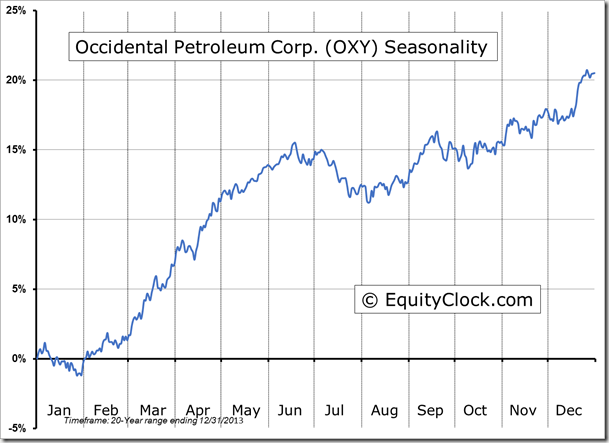
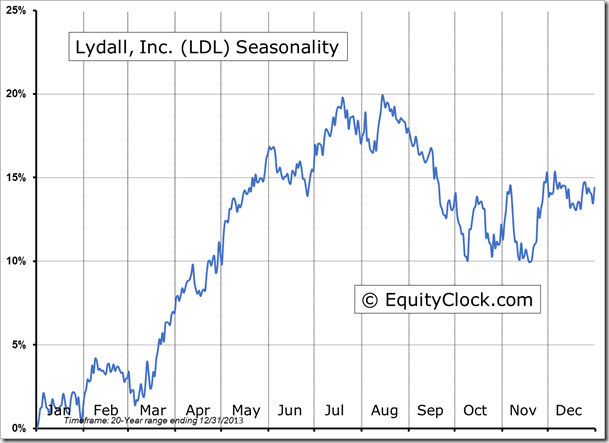
Seasonal charts of companies reporting earnings today:
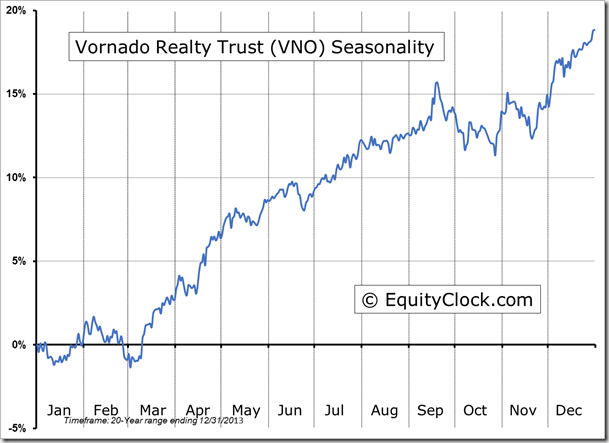
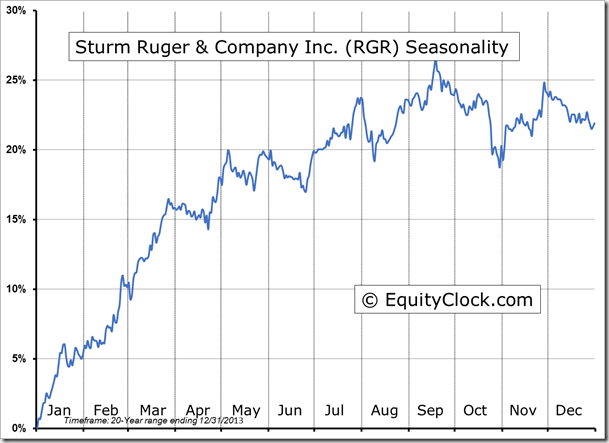
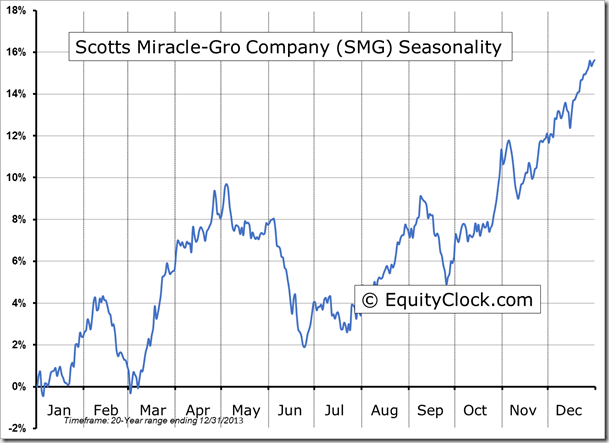
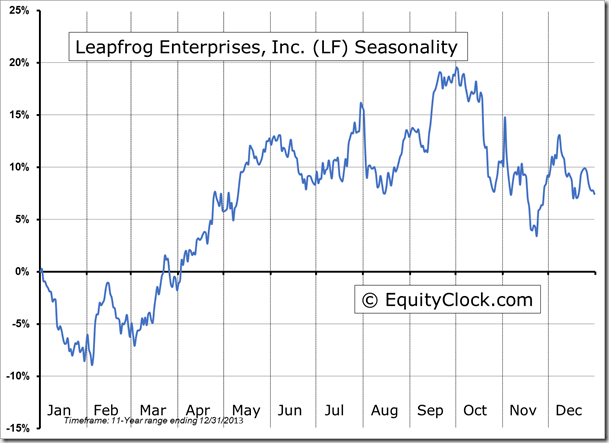
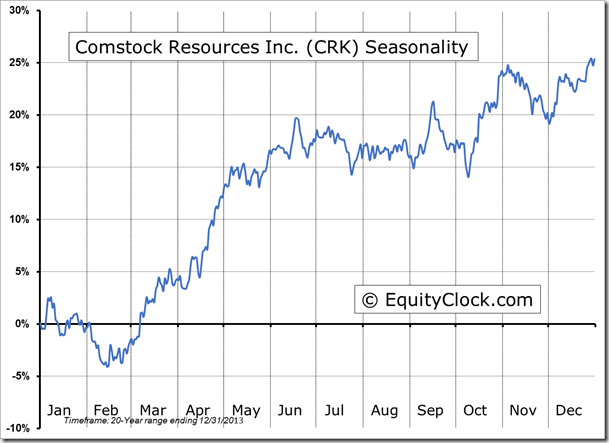
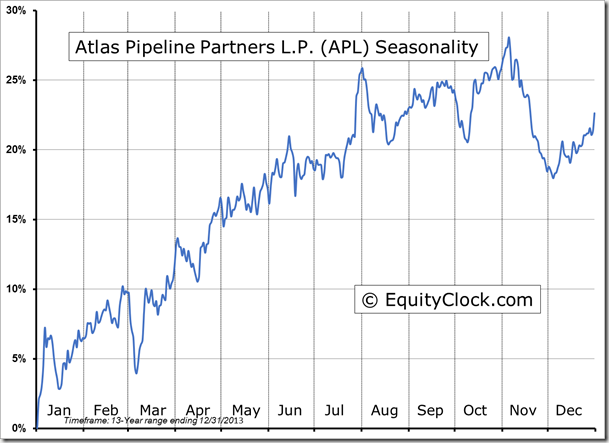
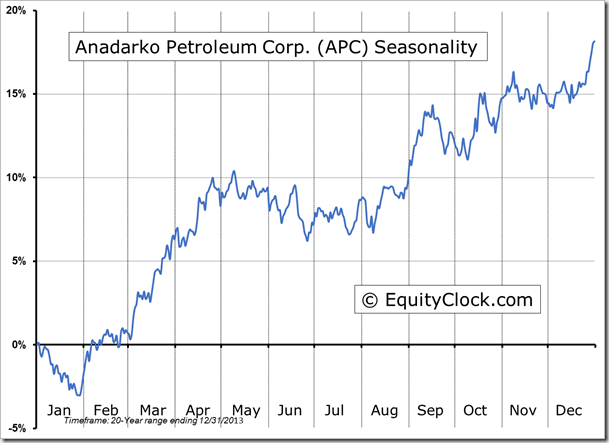
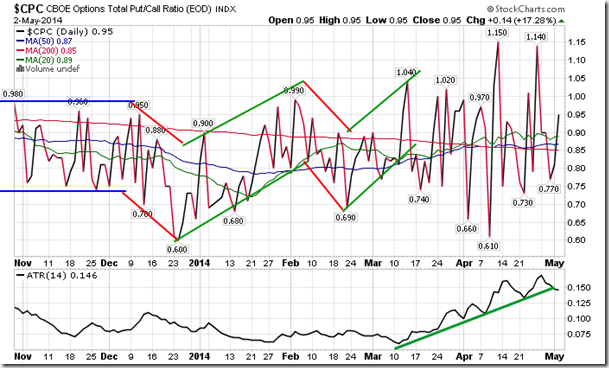
Sentiment on Friday, as gauged by the put-call ratio, ended bullish at 0.95.
S&P 500 Index
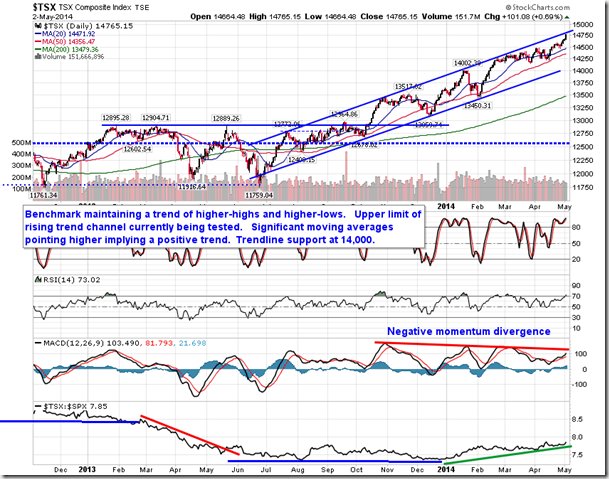
TSE Composite
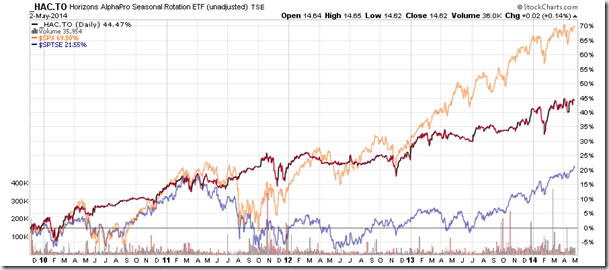
Horizons Seasonal Rotation (TO:HAC) Rotation ETF
- Closing Market Value: $14.62 (up 0.14%)
- Closing NAV/Unit: $14.62 (up 0.09%)
Performance*
| 2014 Year-to-Date | Since Inception (Nov 19, 2009) | |
| HAC.TO | 2.24% | 46.2% |
* performance calculated on Closing NAV/Unit as provided by custodian

