The market remains near its all-time high, but economic earnings continue to decline. This disconnect, in addition to the continued risk of an escalating trade war and projections for slower GDP growth over the next two years, make this the riskiest market we’ve seen in many years. Investors need diligence more than ever to help them avoid stocks with misleading growth.
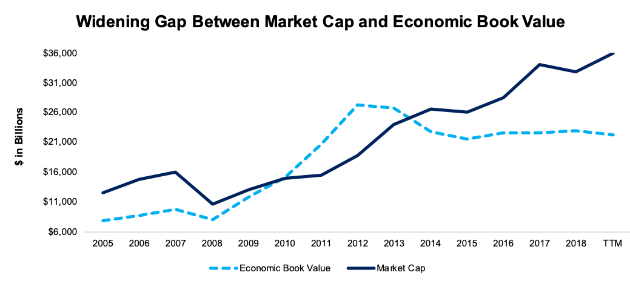
On the other hand, Figure 1 shows how much more expensive – and risky - the market truly is. Economic book value (EBV) – the no-growth growth value for the market – has declined to its lowest level since 2015. Meanwhile, stock prices are near the all-time highs set in September of last year.
Figure 1: Market Cap Vs. Economic Book Value Since 2005

Sources: New Constructs, LLC and company filings.
We’re still nowhere near tech bubble territory, but the market is now more expensive than it’s been at any point since before the ’08 recession. The Small Cap Growth style is the most expensive and risky part of the market and is in the Danger Zone this week.
Economic Earnings Declined After Stripping Out the Impact of Tax Cuts
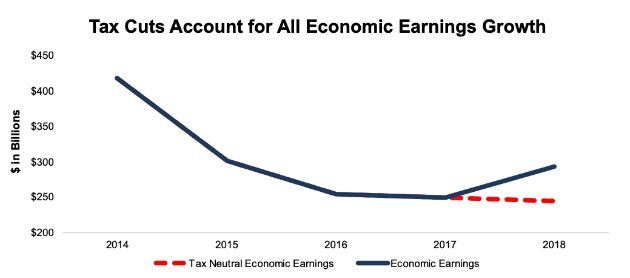
GAAP earnings grew by 23% in 2018, but a deeper look at the number shows how this growth misleads investors. As we’ve shown in previous reports, economic earnings – which reverse accounting distortions and account for the weighted average cost of capital (WACC) – across the broader market have been in a steady decline for several years. Economic earnings declined by 28% in 2015, 15% in 2016, and 2% in 2017. At first glance, it would appear that economic earnings rebounded and grew by 18% last year.
However, Figure 2 shows that the entirety of economic earnings growth in 2018 can be attributed to the corporate tax rate cut. When we remove the impact of the tax cut,[1] we see that economic earnings declined by 2% in 2018, same as 2017.
Figure 2: Economic Earnings vs. Tax Neutral Economic Earnings

Sources: New Constructs, LLC and company filings.
So far, the results from Q1 2019 confirm the thesis that profit growth in 2018 was the byproduct of tax cuts and accounting distortions. For the 1,300+ companies that have filed in the past two weeks, the median company’s TTM GAAP EPS has grown by 16% while its TTM economic earnings per share have declined by 18%.
Mega-Caps Dominate Growth
In addition to overall economic earnings decline, we see a market that is increasingly bifurcated. At the top, a handful of highly profitable mega-cap companies continue to grow economic earnings at a rapid rate. Outside of this small group, the majority of companies have declining profitability.
The Technology sector, for instance, grew aggregate economic earnings from $138 billion in 2017 to $189 billion in 2018. However, all of that growth came from just 25 (out of 430) companies. Just four companies – Micron (NASDAQ:MU), Apple (NASDAQ:AAPL), Microsoft (NASDAQ:MSFT), and Facebook (NASDAQ:FB) – accounted for over 50% of the sector’s economic earnings growth.
The same story shows up in other sectors as well. The 25 largest Financials companies by market cap grew economic earnings by $8 billion in 2018. The remaining 406 companies in the sector saw their economic earnings decline by a combined $6 billion.
Highest Risk in Small Cap Growth
Over the course of this bull market, Small Cap Growth stocks have outperformed the broader market. The iShares Growth ETF (NYSE:IWO) is up 282% over the past decade compared to 223% for the S&P 500 (NYSE:SPY).
This outperformance stands in contrast to the inferior profit growth of small caps vs large caps. The growing disconnect between profit and valuation trends makes Small Cap, especially Small Cap Growth stocks, significantly more risky than large caps. Figure 3 highlights excessive risk in small cap stocks by comparing style ETFs IWO and SPY on the basis of return on invested capital (ROIC), free cash flow yield, price to economic book value (PEBV), and market-implied growth appreciation period (GAP).
Figure 3: Profitability and Valuation Comparison: SPY vs. IWO

Sources: New Constructs, LLC and company filings.
Small Cap Growth stocks earn less than half the ROIC of the S&P 500 and generate negative free cash flow, but they’re still valued at a premium. On a cap-weighted average, the stocks held by IWO are valued at 3.6x their zero-growth value (i.e. economic book value), compared to 2.8x for SPY.
Notably, traditional valuation metrics don’t capture the disconnect in valuation between IWO and SPY. IWO has a P/E ratio of 22, in-line with SPY, and a price to book (P/B) of 3.8, just slightly higher than SPY’s 3.5. Investors who rely on traditional valuation metrics won’t see just how expensive the Small Cap Growth style really is.
Figure 4 shows that IWO holds a significantly higher proportion of Unattractive-or-worse stocks vs SPY as well.
Figure 4: IWO Asset Allocation vs. SPY

Sources: New Constructs, LLC and company filings.
IWO allocates 45% of its portfolio to Unattractive-or-worse stocks compared to 32% for SPY. On the flip side, just 8% of IWO’s portfolio earns an Attractive-or-better rating compared to 23% for SPY.
An Unattractive Small Cap Growth Stock
H.B. Fuller Company (NYSE:FUL) is one of our least favorite Small Cap Growth stocks and earns our Very Unattractive rating. FUL is also in May’s Most Dangerous Stocks Model Portfolio.
FUL encapsulates all the red flags with the Small Cap Growth style discussed above, including:
- Misleading accounting earnings growth that doesn’t create shareholder value
- Low P/E and P/B ratios that don’t capture the real risk in the stock
- Unrealistically high growth expectations embedded in the stock price
Over the trailing twelve months (TTM) period, FUL has grown revenue by 19% and GAAP EPS by 48% year-over-year. However, none of this growth comes from the firm’s core operations. All of it is driven by the acquisition of Royal Adhesives and Sealants in late 2017, which cost $1.6 billion (39% of invested capital), and $16 million (1% of revenue) in non-operating pension income in 2018 due to the company’s unusually high 7.75% expected return on plan assets assumption.
When we strip away accounting distortions, we find that the acquisition of Royal Adhesives and Sealants added $41 million in after-tax operating profit (NOPAT) and $1.7 billion in average invested capital in 2018, which gives the deal an ROIC of just 2.4%, or less than half of FUL’s WACC of 6.8%. The low ROIC on this deal means that, even though it boosted accounting earnings, it decreased economic earnings and destroyed shareholder value.
Even worse, FUL’s core business is declining once you strip out the impact of the acquisition. The company reported organic sales growth of -1% in Q1 2019. This organic sales decline shows that FUL is a growth stock in name only.
Some investors may not worry about FUL’s lack of organic growth due to its low P/E of 17 and P/B of 2, but these metrics are misleading. As noted above, FUL’s GAAP earnings are inflated by non-operating pension income, while goodwill – which can be written down at any moment – accounts for 112% of its accounting book value. FUL’s PEBV of 3.5 is well above the market average of 2.8.
Our reverse DCF model quantifies the exact growth expectations implied by FUL’s stock price and reveals that the stock is overvalued.
In order to justify its valuation of $45/share, FUL must grow NOPAT by 8% compounded annually for the next 8 years. See the math behind this dynamic DCF scenario.
For a company whose organic sales are declining, that level of growth seems unrealistic.
Even if FUL grows NOPAT at half that rate, 4%, for 10 years, the stock is worth just $30/share today, a 32% downside from the current stock price.
Where to Find Value in a Dangerous Market
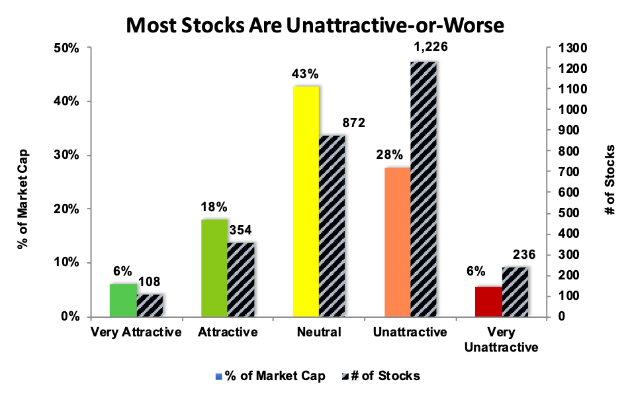
Even though the Small Cap Growth style carries the highest risk for investors, that doesn’t mean all large caps or value stocks are safe. As Figure 4 showed, SPY still allocates a higher percentage of its portfolio to Unattractive-or-worse stocks than to Attractive-or-better. Figure 5 shows that just 17% of the stocks we cover[2] (accounting for 24% of the total market cap) earn an Attractive-or-better rating.
Figure 5: Rating Distribution for Our Entire Coverage Universe

Sources: New Constructs, LLC and company filings
Investors who still want to find value in the market need to look for companies whose valuations have been artificially depressed due to negative sentiment. There is currently a “Micro-Bubble” in overhyped stocks, like Netflix (NASDAQ:NFLX), Uber (NYSE:UBER), Amazon (NASDAQ:AMZN), and Tesla (NASDAQ:TSLA), that trade at absurd valuations based on the promise of future market dominance.
These unrealistic valuations also create micro-bubble winners, companies that are undervalued due to overstated fears of market share loss. Walmart (NYSE:WMT), Disney (NYSE:DIS) and General Motors (NYSE:GM), all trade at cheap valuations despite strong profitability and significant growth opportunities. When the micro-bubble bursts, these highly profitable incumbents should benefit.
Investors that want to find safe, undervalued stocks in a dangerous market should look to these highly profitable large cap companies and avoid the overvalued Small Cap Growth style.
