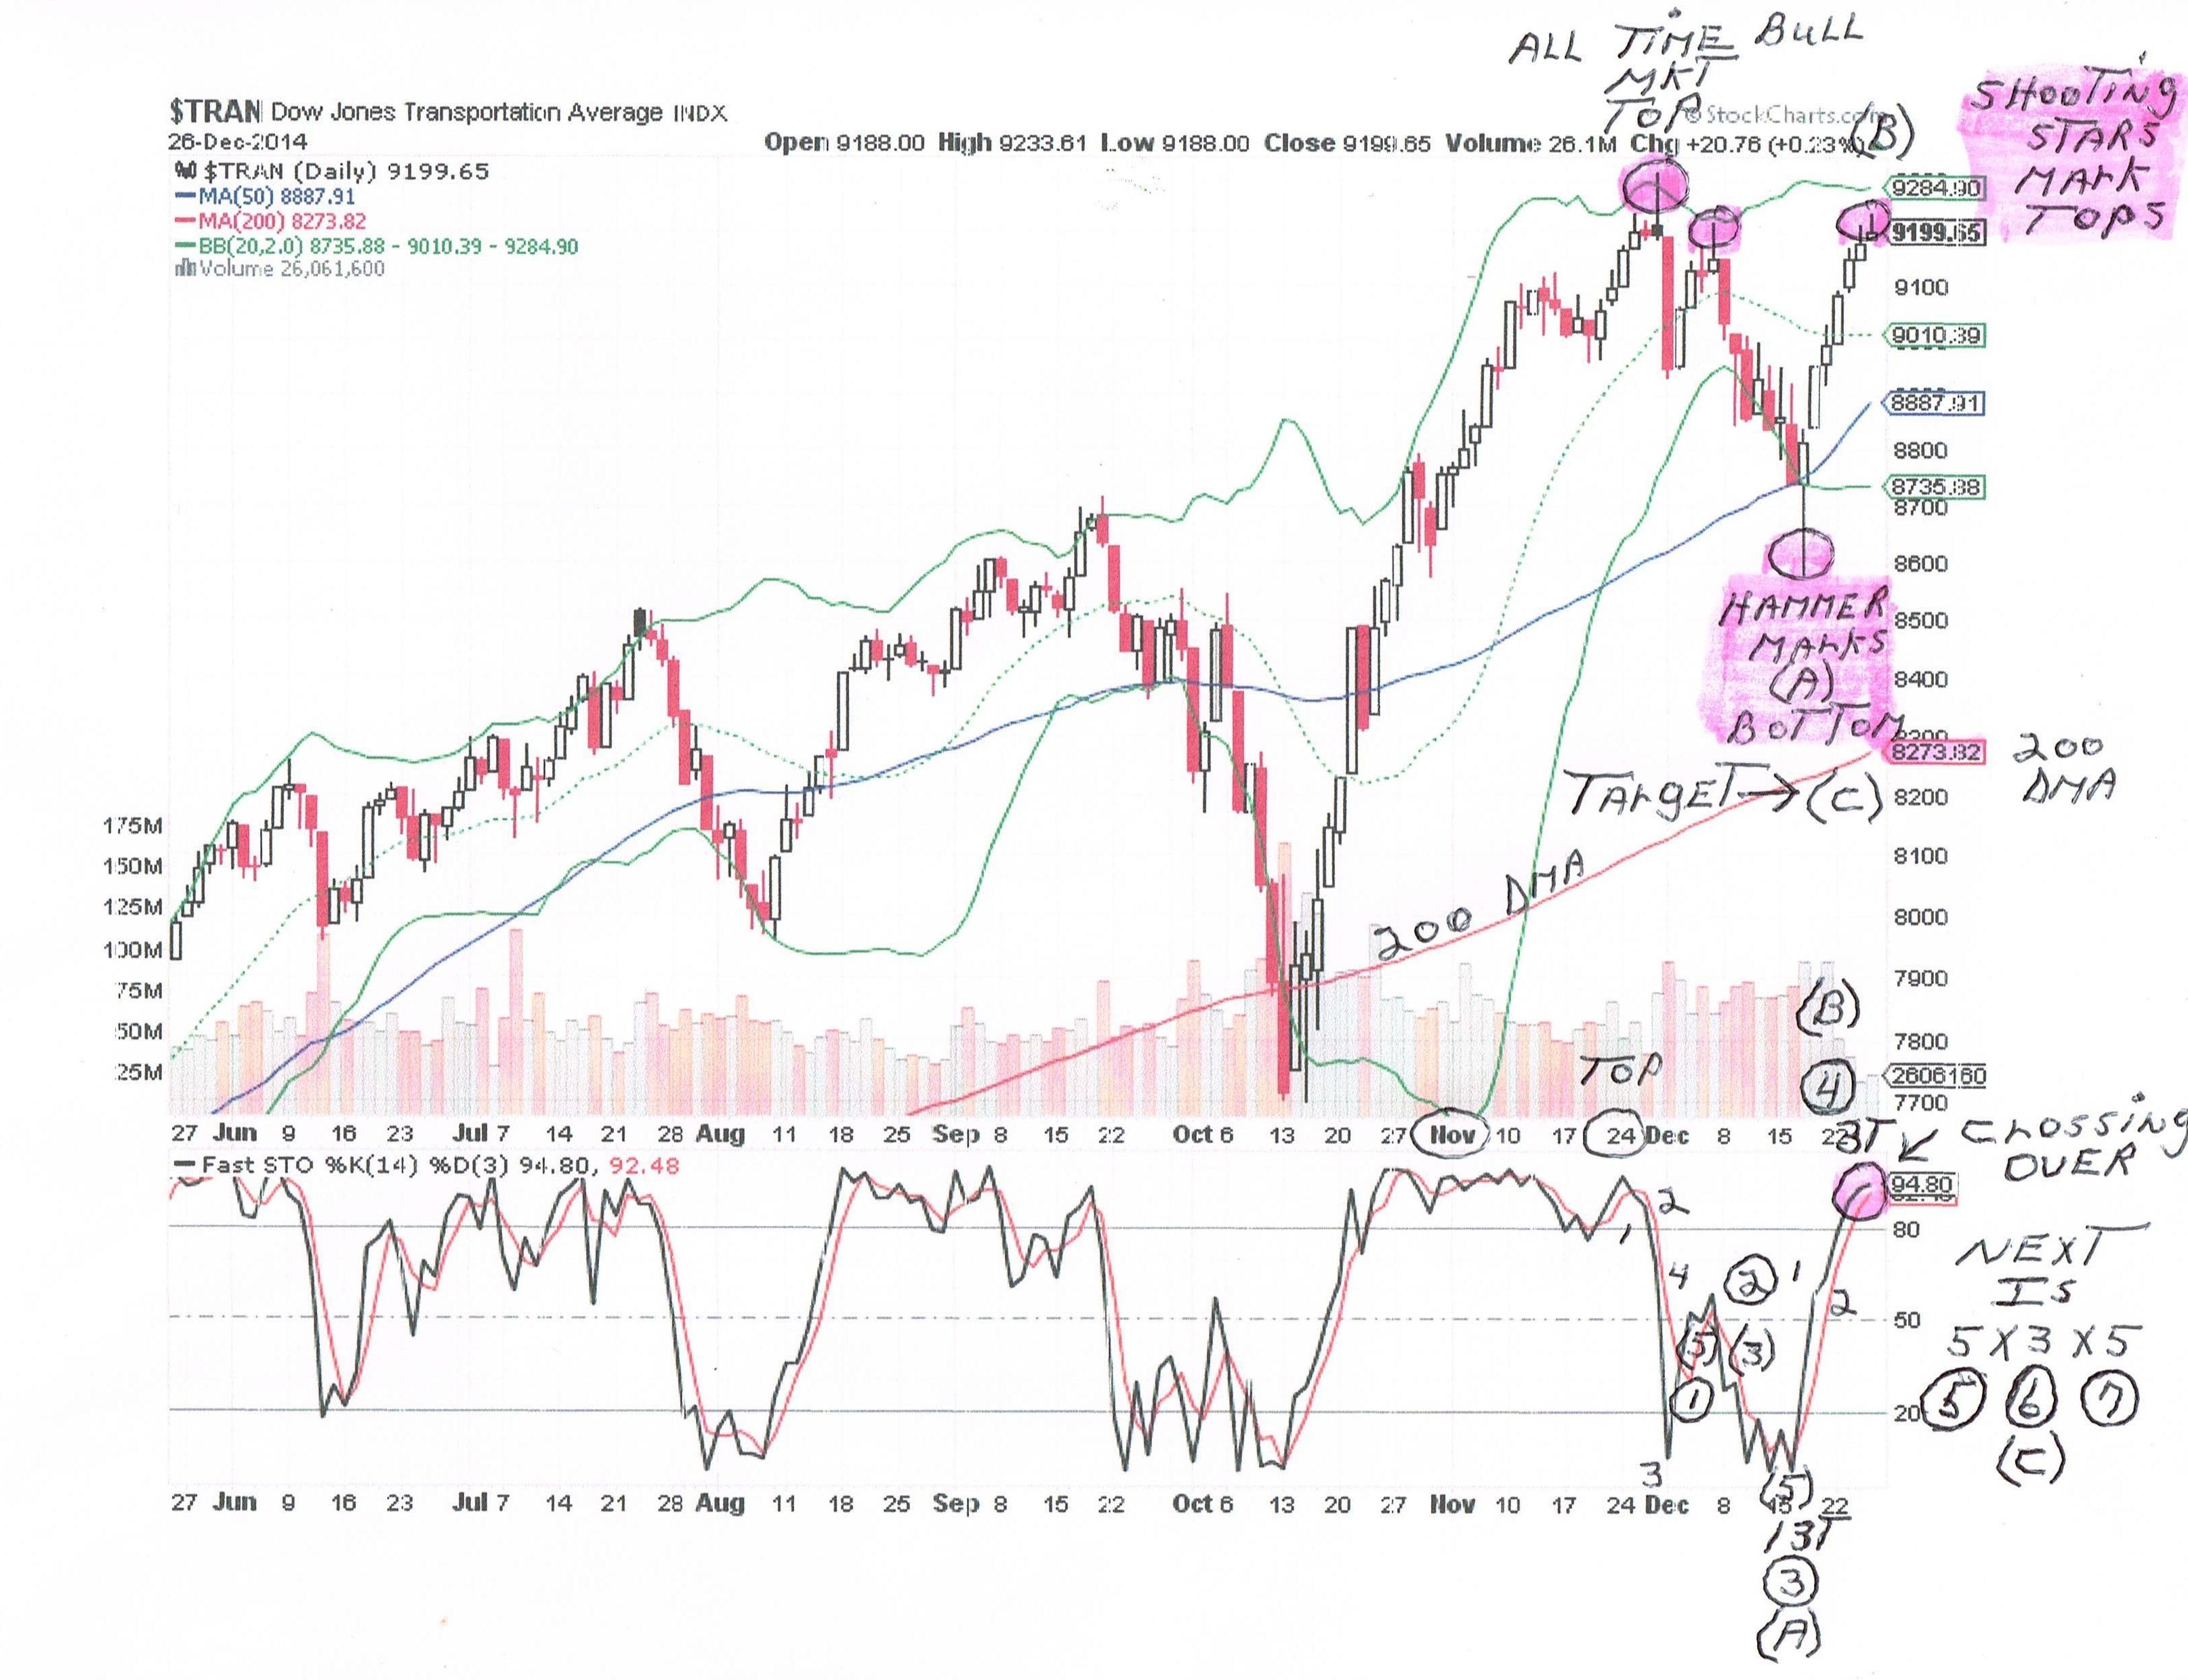
I believe my current Elliott Wave pattern is not complete and we still have 13 more sub waves to be processed to the downside. I believe what we have been experiencing is a strong counter trend rally of 5 sub waves. Notice that the Transports and the NYSE Composite have not broken their old highs, that were established on November 24th.
November 24th was the start of the last downtrend. Then we reversed up on December 16th and experienced this current strong counter trend rally. Now the counter trend rally is close to topping and we "should" go down again to complete the whole Elliott Wave pattern of A=13 down, B=5 up, and then finally the C down will be another 13 daily sub waves.
There is a good chance that we topped out on this current uptrend last Friday (12/26). If we did, we could start to see some down momentum and volume next week.
A couple of other technical indicators are confirming a potential top last Friday (12/26). They include a new Russell 2000 top at 1215 and a crossover on the Fast Stochastics for the Russell 2000 and the S&P 500. The Transports daily chart is also showing some great candlestick patterns. I have attached a copy of the Transports daily chart with this article.
if you want a copy of the Transports daily chart in a adobe format, you can contact me via my web site. With adobe you can "blow" it up and really see the pattern detail more clearly.
The wild card is will there be enough traders coming back on Monday (12/29) to make a difference. If not the market will probably just keep going up slowly.

