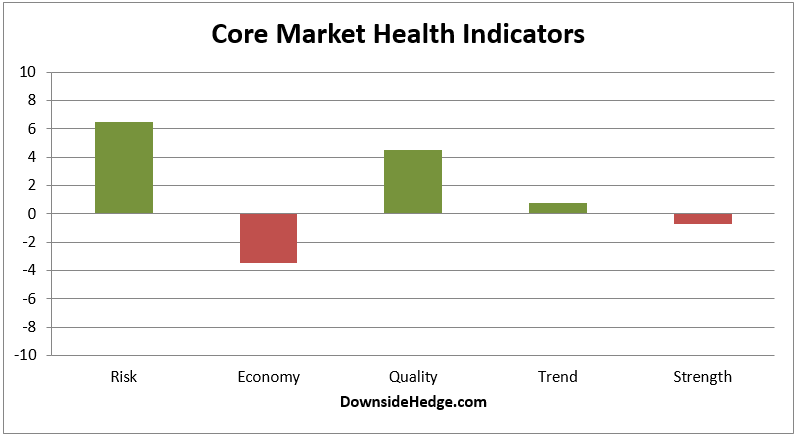
Over the past week, my core market health indicators bounced around, but didn’t move enough to make any changes to the core portfolios.

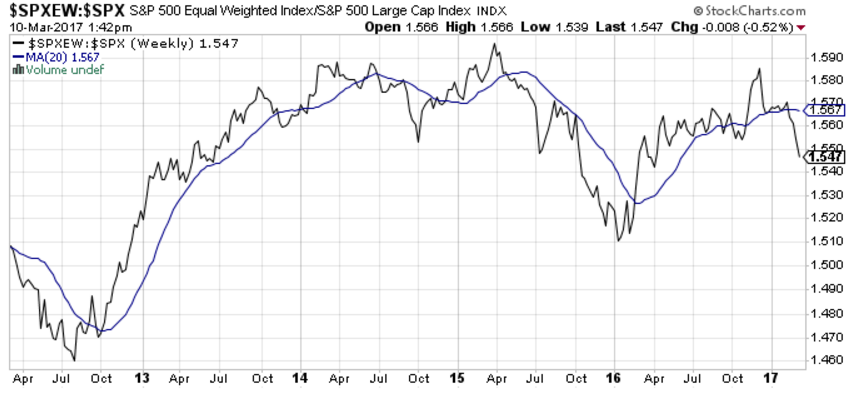
I’ve started to see a lot of chatter stating that this is the start of a larger top. So far, I’m not seeing the same evidence. There is a bit of deterioration in some of my measures of breadth, but nothing drastic for a small decline in the general market. The most significant change comes from the ratio between the S&P 500 Equal Weighted and the S&P 500 Index. As I mentioned last month, when this ratio dips below its 20 week moving average we usually see some consolidation. The dip was delayed, but it seems that we’re now experiencing it.

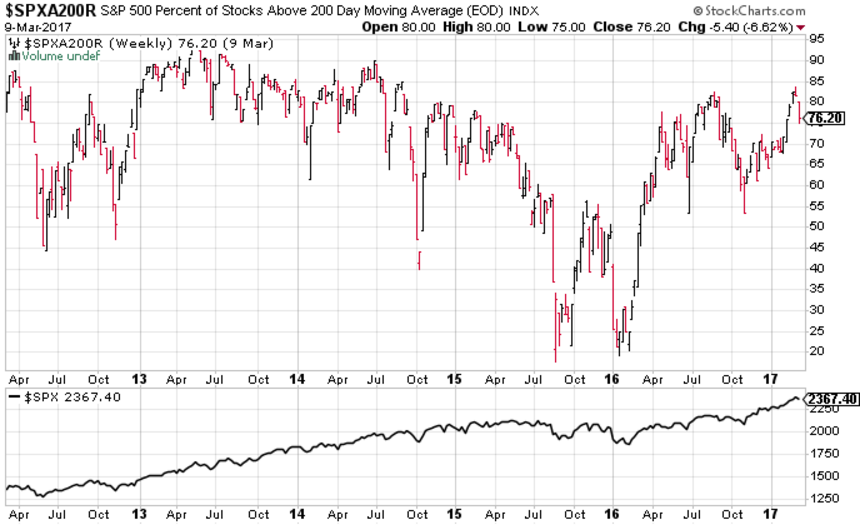
Another measure of breadth is the percent of stocks above their 200 day moving average. Long time readers know that I don’t worry until it falls below 60%. As you can see, there are still a healthy number of stocks above their 200 day moving average.

Conclusion
There is some weakness in my core health indicators and the ratio between mega cap stocks and large cap stocks is signalling rotation. It still remains to be seen if the rotation is a flight to safety. It’s time to perk up and watch the market, but no worries yet.