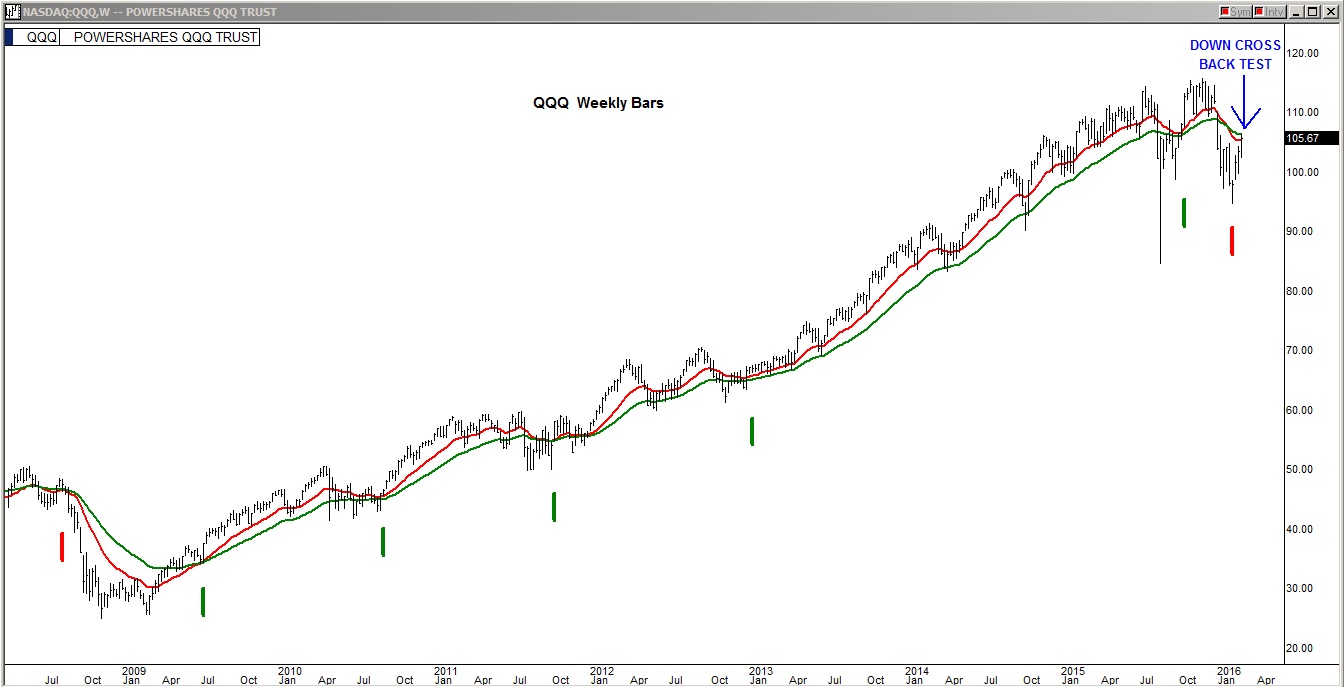
I am continuing my discussion from my two previous posts focused on the critical down crosses in the NASDAQ:QQQ and the S&P 500. As the March monthly bar opened and the down crosses became clearly visible the prop the market coalition shifted into crisis intervention mode and jammed the oil futures and S&P futures in a hail mary short squeeze effort to see if what has already happened can possibly be undone. While it was impressive market action, the NYMO has now passed the 104 mark where markets typically roll over and it's the highest reading for many years. We will take a look at the chart below to examine how the monumental short squeeze extended the already in progress backtest effort on the QQQ.
In this QQQ weekly chart where we see the recent critically important down cross and the current backtest climb. Technically, the price bar has now reached its backtest point, the larger green line, but most had expected a line backtest where the smaller red line makes it back to the underside of the green line which now looks more in doubt as we are very short term overextended.

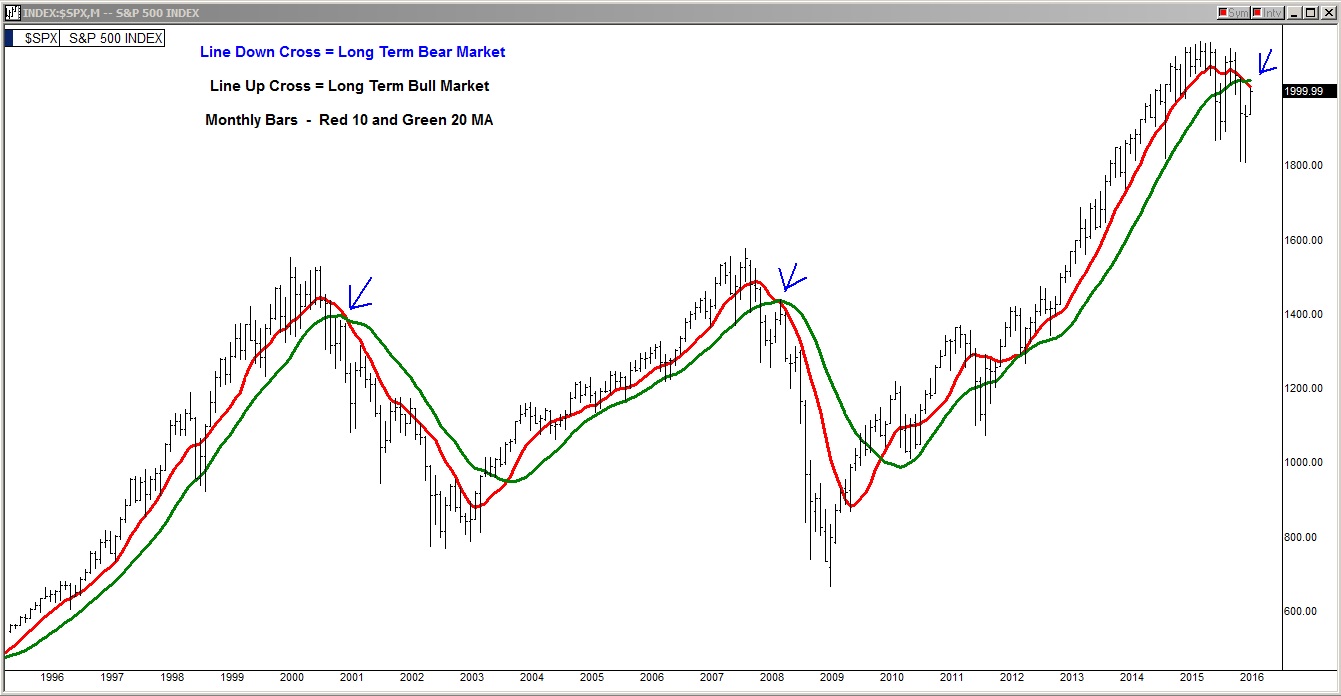
Next, the S&P monthly 10/20 chart, the only longterm bear market / bull market indicator with a 100% accuracy record going back several decades. We see that just as soon as the March bar opened it clearly showed the ominous down cross and the massive make the market do the opposite effort was on to keep investors in their stocks. Nonetheless, the chart is what the chart is and the longterm bear market down cross has clearly happened and even if they took this market up 1% a day, every day, through the end of March it would still would not undo the down cross.

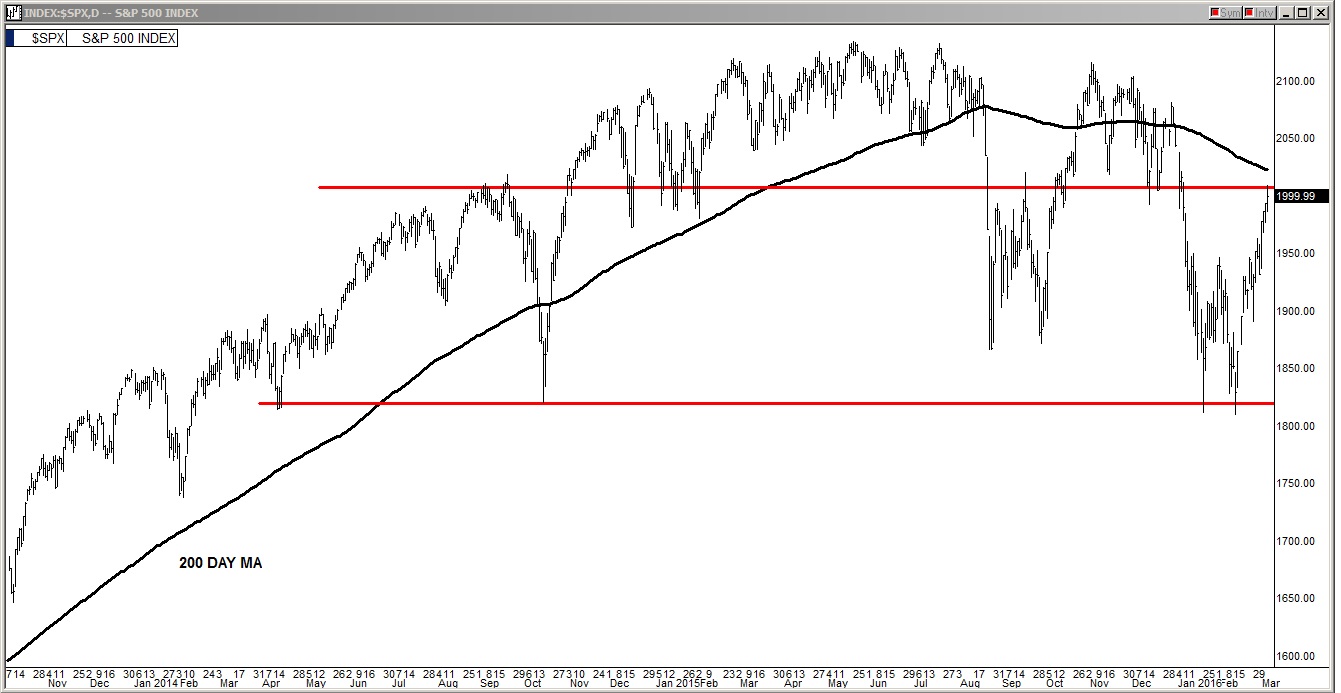
Next taking a look at the psychologically important 2000 level where the S&P closed Friday, we see that this a major resistance level going back two years with the black 200 SMA line just above it making it an even stronger resistance level.

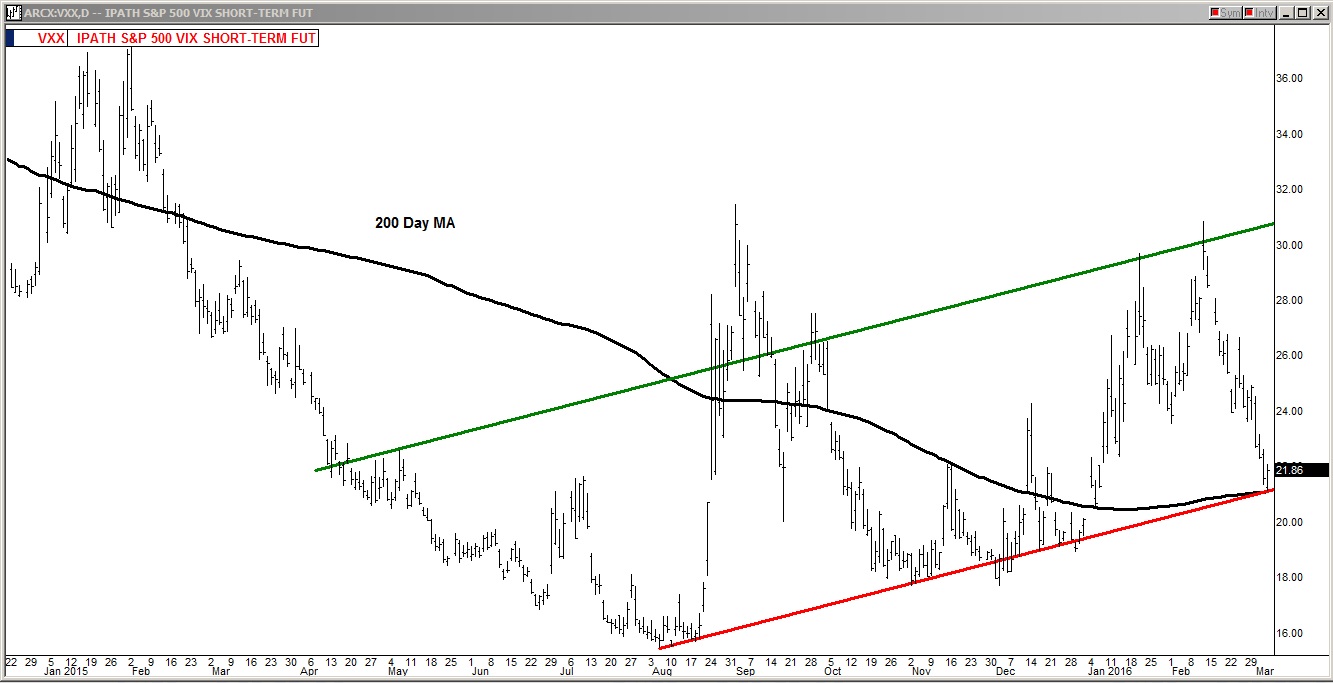
Lastly, taking a look at the NYSE:VXX (VIX Short Term Futures) chart we see that Friday it stopped falling at its lower channel line which is also its 200 day moving average line (shown with a black line). This is double support to turn the VXX and VIX back upwards producing a market sell off.

When you closely analyze these four charts and the NYSE McClellan oscillator (NYMO) nosebleed reading of 104, one must at least consider taking a cautious stance on what has transpired so far in March.
