💎 Fed’s first rate cut since 2020 set to trigger market. Find undervalued gems with Fair ValueSee Undervalued Stocks

Market Cycles Point Toward A Down Week For Stocks

Published 11/26/2017, 12:26 AM
Updated 07/09/2023, 06:31 AM
US500
-
GS
-

Summary:

  • The S&P 500 moved higher last week, rising by 0.9%.
  • Uncertainty in Europe ticked up, as Angela Merkel’s attempt to form a coalition government in Germany hit an impasse.
  • Chinese stocks dropped by 3% on Thursday as the market became increasingly concerned with the country’s debt and inflated asset values.

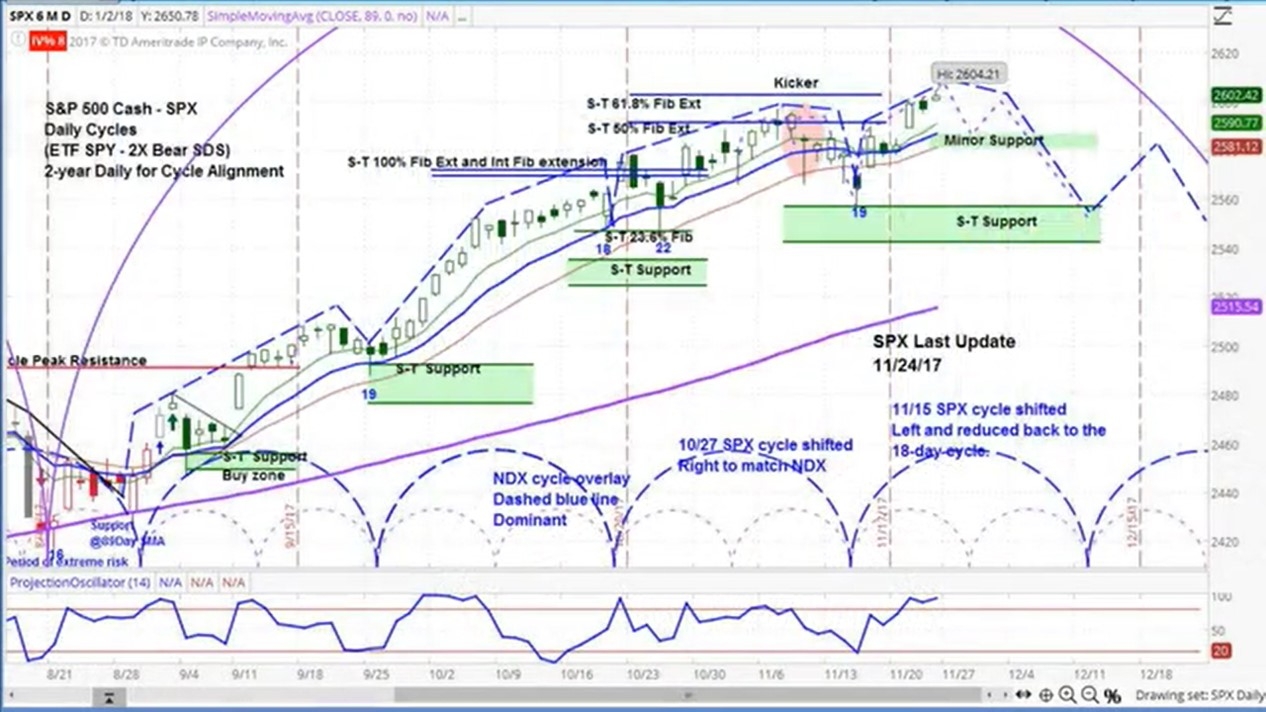
Daily chart for the S&P 500 (SPX)

The stock market moved higher last week, with the S&P 500 (SPX) moving up 24 points to 2602.

On Monday, German Chancellor Angela Merkel’s attempt to form a coalition government broke down, as the pro-business Free Democratic Party pulled out of coalition talks, which was followed by a brief pullback in equity futures. This increases political uncertainty in Europe, as Germany has been a source of stability for the last decade.

On Tuesday, (NYSE:Goldman Sachs) announced that it was bullish on stocks in Europe and the US, which pushed markets higher. On Wednesday, the Federal Open Markets Committee released its most recent meeting minutes, which indicated a concern with inflation as well as a potential stock market reversal that could hurt the overall economy.

On Thursday, Chinese stocks dropped 3% and sovereign bond yields rose above 4%, as the market grew increasingly concerned with complacency towards debt. On Friday, the purchasing manager’s index decreased to 53.8 from 54.6 for manufacturing and to 54.3 from 54.6 for services. The US markets were relatively quite towards the end of the week due to the Thanksgiving holiday.

The SPX chart above shows our projection for the coming week: a move lower and then higher again as the short-term cycle ends and a new one begins. As we noted in last week’s article, if the stair step pattern that has been in place from the start of this intermediate cycle is broken, keep your eyes peeled for a move lower.

The blue-dotted half circles at the bottom of the chart illustrate the short-term cycle patterns.

Latest comments

Loading next article…
Risk Disclosure: Trading in financial instruments and/or cryptocurrencies involves high risks including the risk of losing some, or all, of your investment amount, and may not be suitable for all investors. Prices of cryptocurrencies are extremely volatile and may be affected by external factors such as financial, regulatory or political events. Trading on margin increases the financial risks.
Before deciding to trade in financial instrument or cryptocurrencies you should be fully informed of the risks and costs associated with trading the financial markets, carefully consider your investment objectives, level of experience, and risk appetite, and seek professional advice where needed.
Fusion Media would like to remind you that the data contained in this website is not necessarily real-time nor accurate. The data and prices on the website are not necessarily provided by any market or exchange, but may be provided by market makers, and so prices may not be accurate and may differ from the actual price at any given market, meaning prices are indicative and not appropriate for trading purposes. Fusion Media and any provider of the data contained in this website will not accept liability for any loss or damage as a result of your trading, or your reliance on the information contained within this website.
It is prohibited to use, store, reproduce, display, modify, transmit or distribute the data contained in this website without the explicit prior written permission of Fusion Media and/or the data provider. All intellectual property rights are reserved by the providers and/or the exchange providing the data contained in this website.
Fusion Media may be compensated by the advertisers that appear on the website, based on your interaction with the advertisements or advertisers.
© 2007-2024 - Fusion Media Limited. All Rights Reserved.