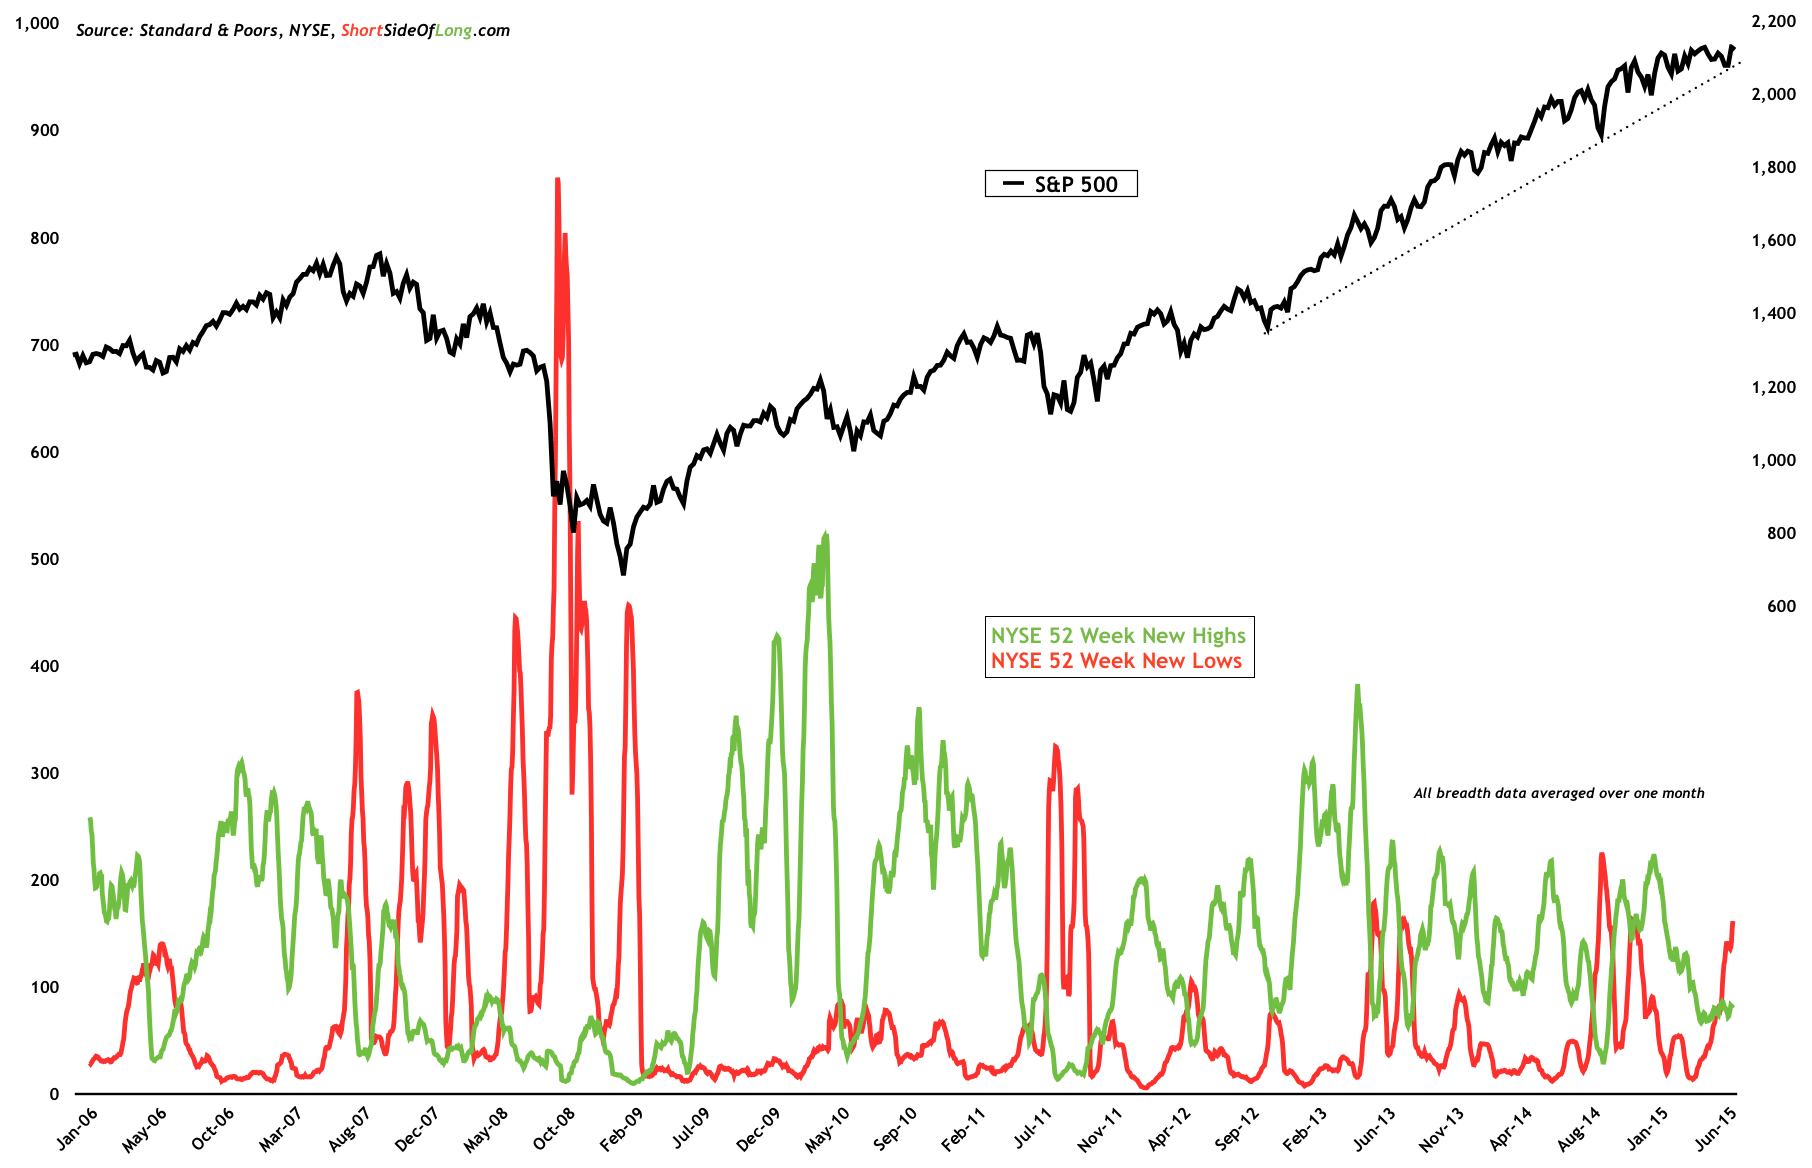
Chart Of The Day: 52 week new lows continue to dominate the market internals
Since finding a short-term bottom on its 200 day moving average and its uptrend line in the first week of July, the S&P 500 (SPDR S&P 500 (ARCA:SPY)) has managed to rally all the way back towards its bull market highs. One very important point I would like to make is, despite the S&P 500 being only several points away from a new record, breadth participation has been very weak.
Consider that over the last three trading sessions NYSE breadth has registered 201, 301 and 214—new 52 week lows respectively. When we compare these numbers to 52 week new highs, we can see that the bears continue to dominate the market internals.
Today’s chart clearly displays that over one month, rising 52 week new lows continue to dominate new highs. In other words, while a handful of stocks keep pushing the S&P higher, certain sectors of the index are still in a correction mode.

