Weekly Review
It was another action-filled week in the financial markets with the S&P 500 sliding another 20 points lower, as oil ended up flat at $48.76 despite breaching the $50 once again. The dollar on the other hand weakened heavily following an awful jobs report, helping gold surge $35 for the week, and 10-year Treasury Yields declining by 15 points to 1.71%.

US Economic Data
Investors were treated to a flurry of economic data in the US with majority of the focus being placed on non-farm payrolls. For the month of May, the US economy created a dreadful 38,000 jobscompared to expectations of 159,000 jobs while the unemployment rate dropped to 4.7% from 4.9%. As a result of the weak job numbers, the market has now lowered a possibility of a rate hike in June with the Fed Funds rate showing a probability of only 4%.
On the other hand, the S&P/Case-Shiller national home index showed that US home prices increased by 5.4% in March beating expectations for a 5.1% increase; largely due to the limited supply of houses and a robust labour market.
Furthermore, consumer spending for the month of April increased by the most in seven years indicating a stronger second quarter is likely underway after a weak start of the year. Understanding this, households seem to be gaining confidence in the economy from wage increases, and finally putting their savings from lower gas prices into good use. In addition, Core PCE Price Index increased 0.2% in April which will provide the Fed a good sign that inflation is creeping up towards its 2% target. Similar to his colleagues, Fed official James Bullard stated earlier this week that the central bank is indeed prepared for a rate hike this summer contingent on strong economic data, and limited financial market volatility.
Market Correlations
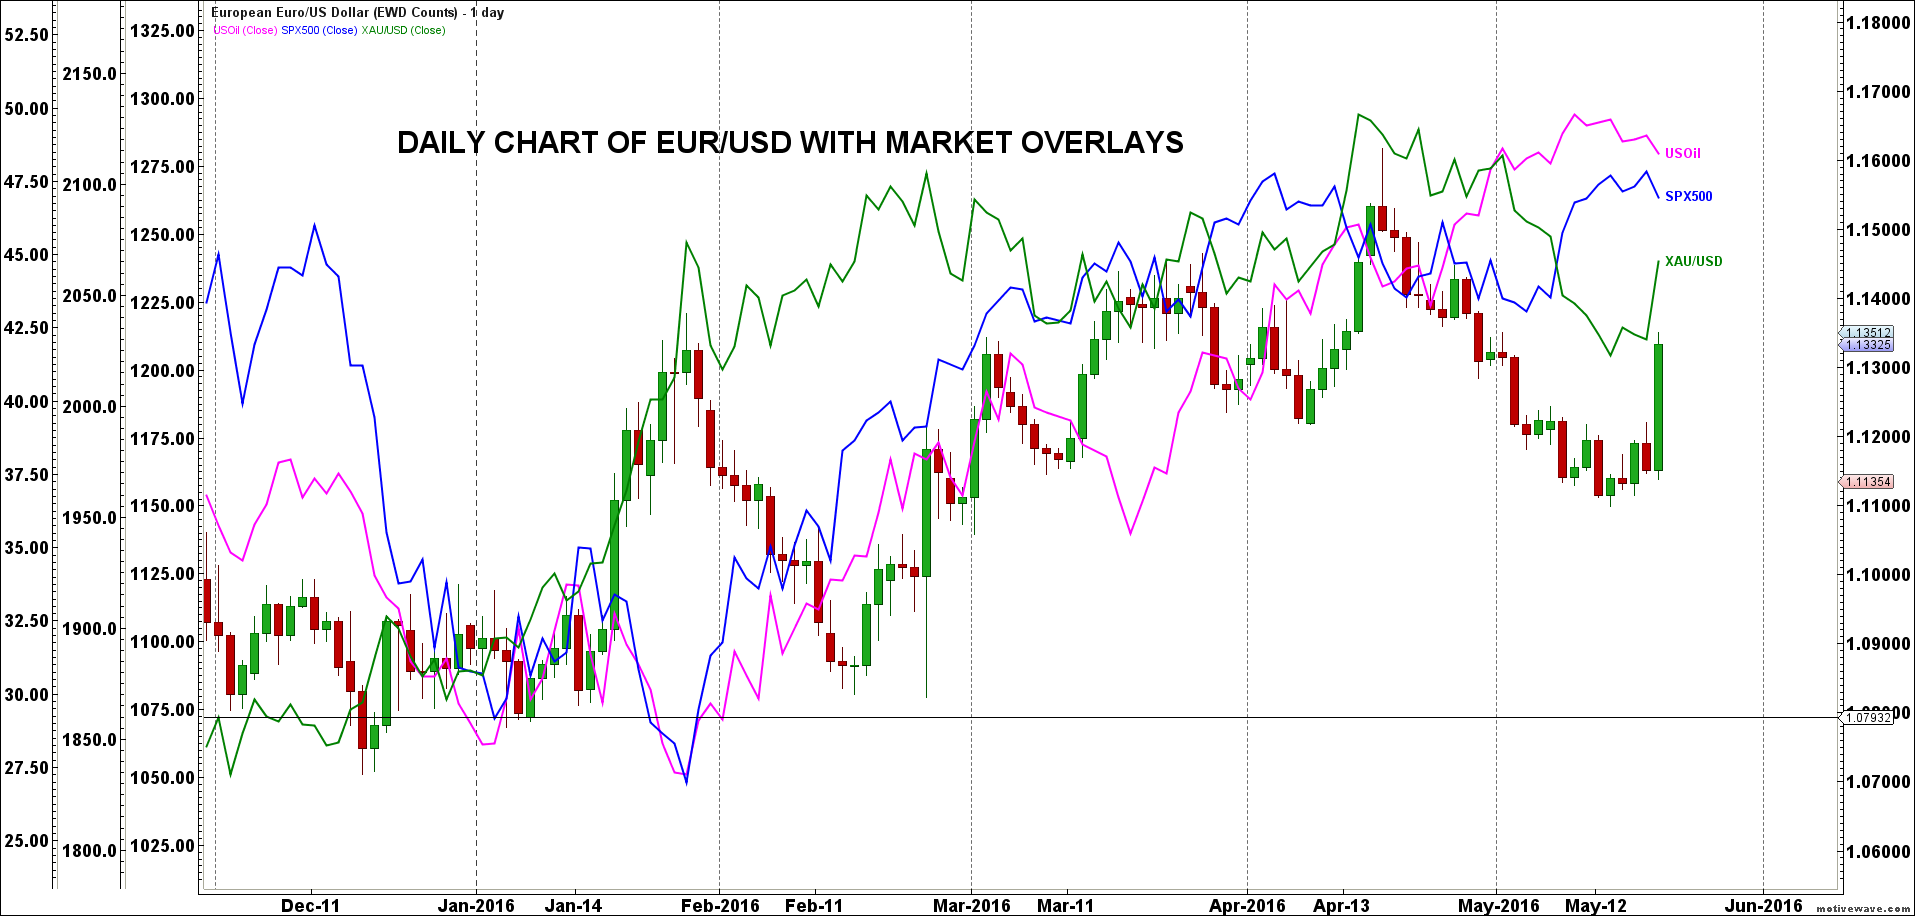
The chart below shows how well the EUR/USD, oil, S&P and gold have correlated since January 2016. This week, gold and the dollar followed their inverse relationship, with the dollar selling off substantially after non-farm payroll and gold taking off. Also, the S&P 500 price action followed the movement of oil this week.
EUR/USD
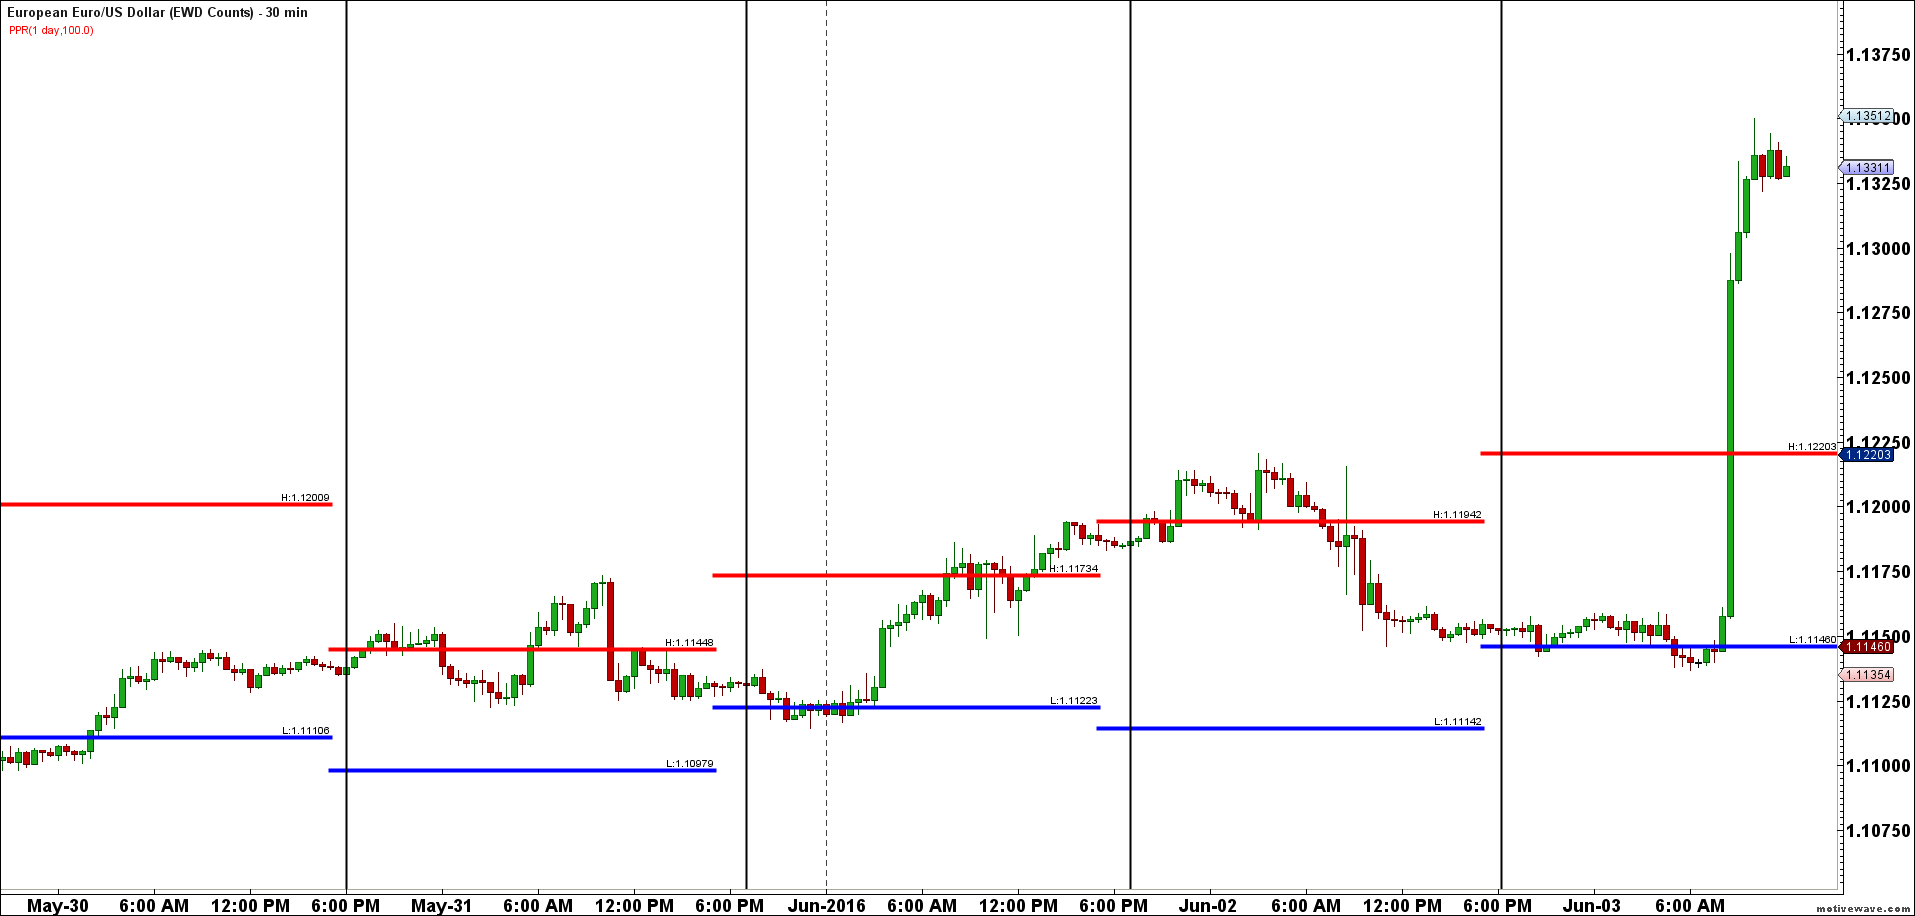
Meanwhile, all eyes were on Mario Draghi as he informed that the ECB will continue to buy 80 billion Euros worth of bonds under its massive QE program. More importantly, Draghi maintained his inflation outlook for the Eurozone despite not incorporating the stimulus program in the previous forecasts – hinting that the asset purchases may not bring the desired results any time soon. With this in mind, the Eurozone economy continues to face a deflationary environment as consumer prices fell 0.1% in May y-o-y – the fourth straight month of declining prices. Despite the slow recovery, there is still a significant amount of pressure on whether the ECB will be able to deliver upon meeting its 2% inflation target. Bottom line for post Draghi comments, the EUR/USD weakened slightly and then range traded for the rest of the day, prior to Friday’s NFP release.
Heading into next week, from an Elliott Wave perspective, we are continuing with a sideways corrective bias with the topside resistance between 1.1600 – 1.1800 and on the downside between 1.0400 – 1.0600. Continue to trade the swing moves within this range with the current short term swing pointed higher. (see video for current Elliott Wave count.)
OIL
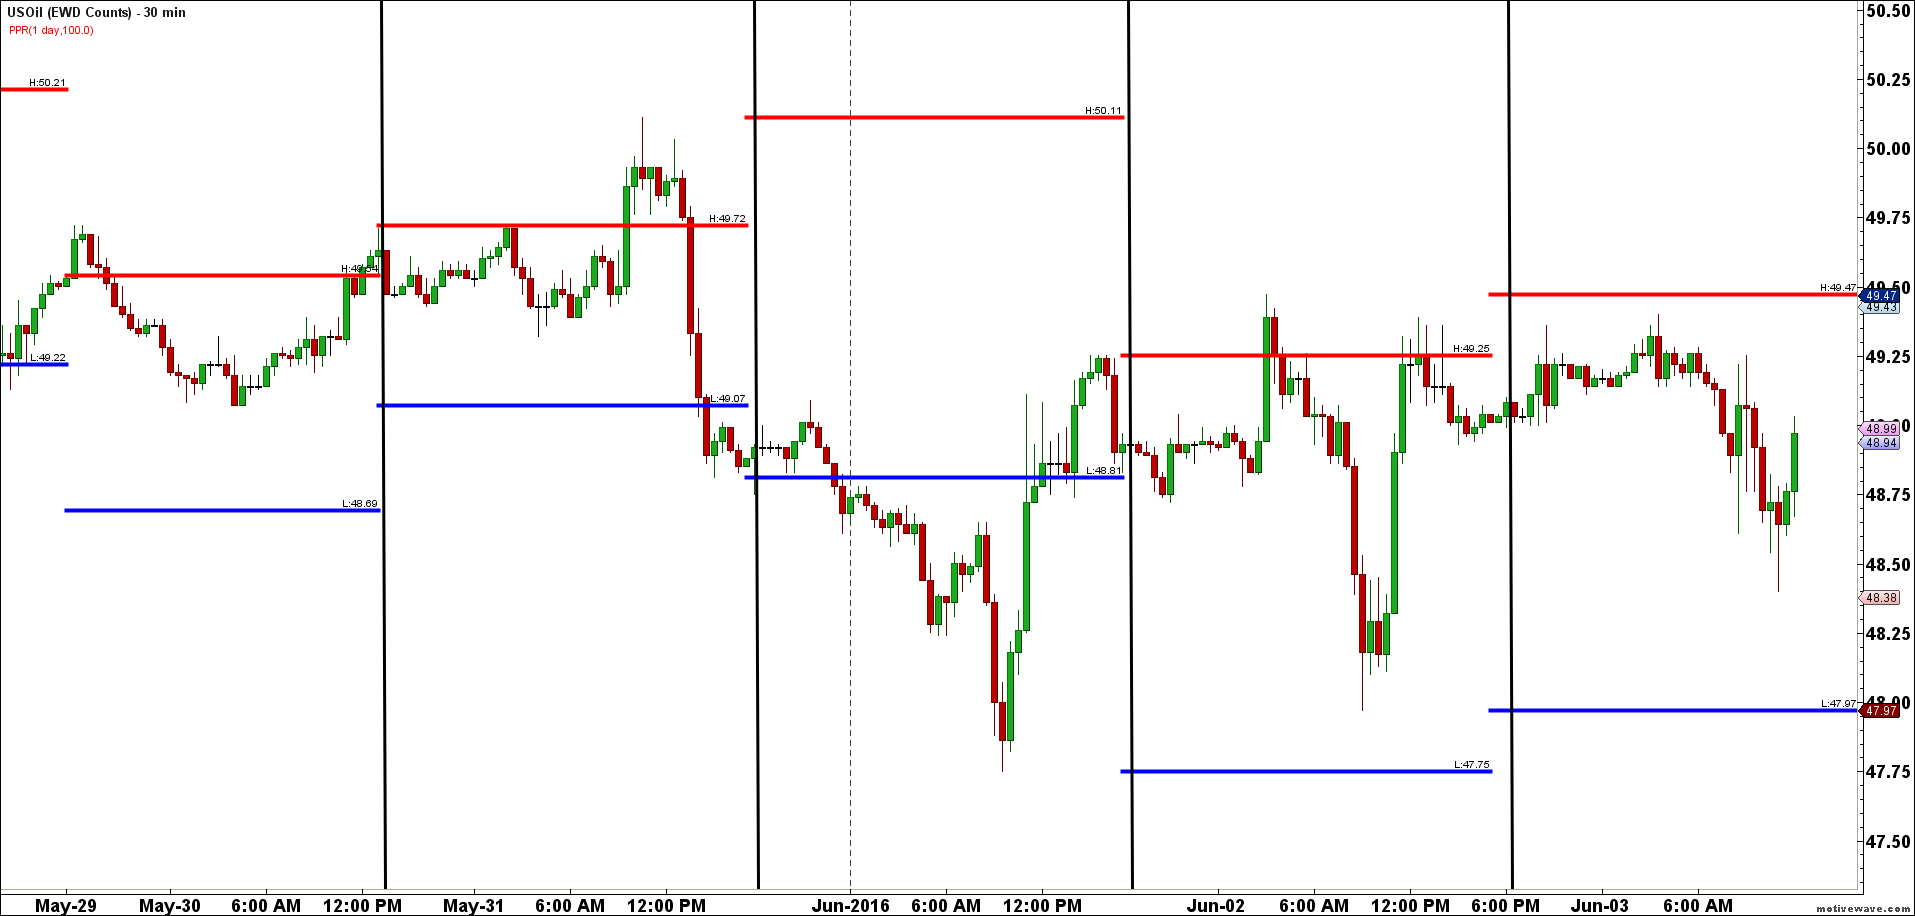
Oil once again failed to close above the psychological $50 benchmark, as crude prices reached a high of $50.1 on Tuesday before selling off to a low of $47.75 on Wednesday. The large drop was led by reports that Iraq will supply 5 million extra barrels to its partners in order to capture more market share. The much anticipated OPEC meeting in Vienna on Thursday proved to be nothing out of the ordinary as the cartel failed to agree upon an output ceiling or introduce individual member production quotas. This comes as no surprise given that Iran is hesitant on capping its production, and looking to increase their production to pre-sanction levels. With no agreement, the market sold off to test the weekly lows. Nonetheless, crude oil still managed to end the week flat as US oil inventory declined by 1.4 million barrels last week in spite of expectations for a 2.5-million-barrel drop. When this news came out, oil traded $1.25 higher to retest the previous high. Bottom line for next week: Oil will continue to range trade between $47 and $50, which is also consistent with our wave count.
GOLD
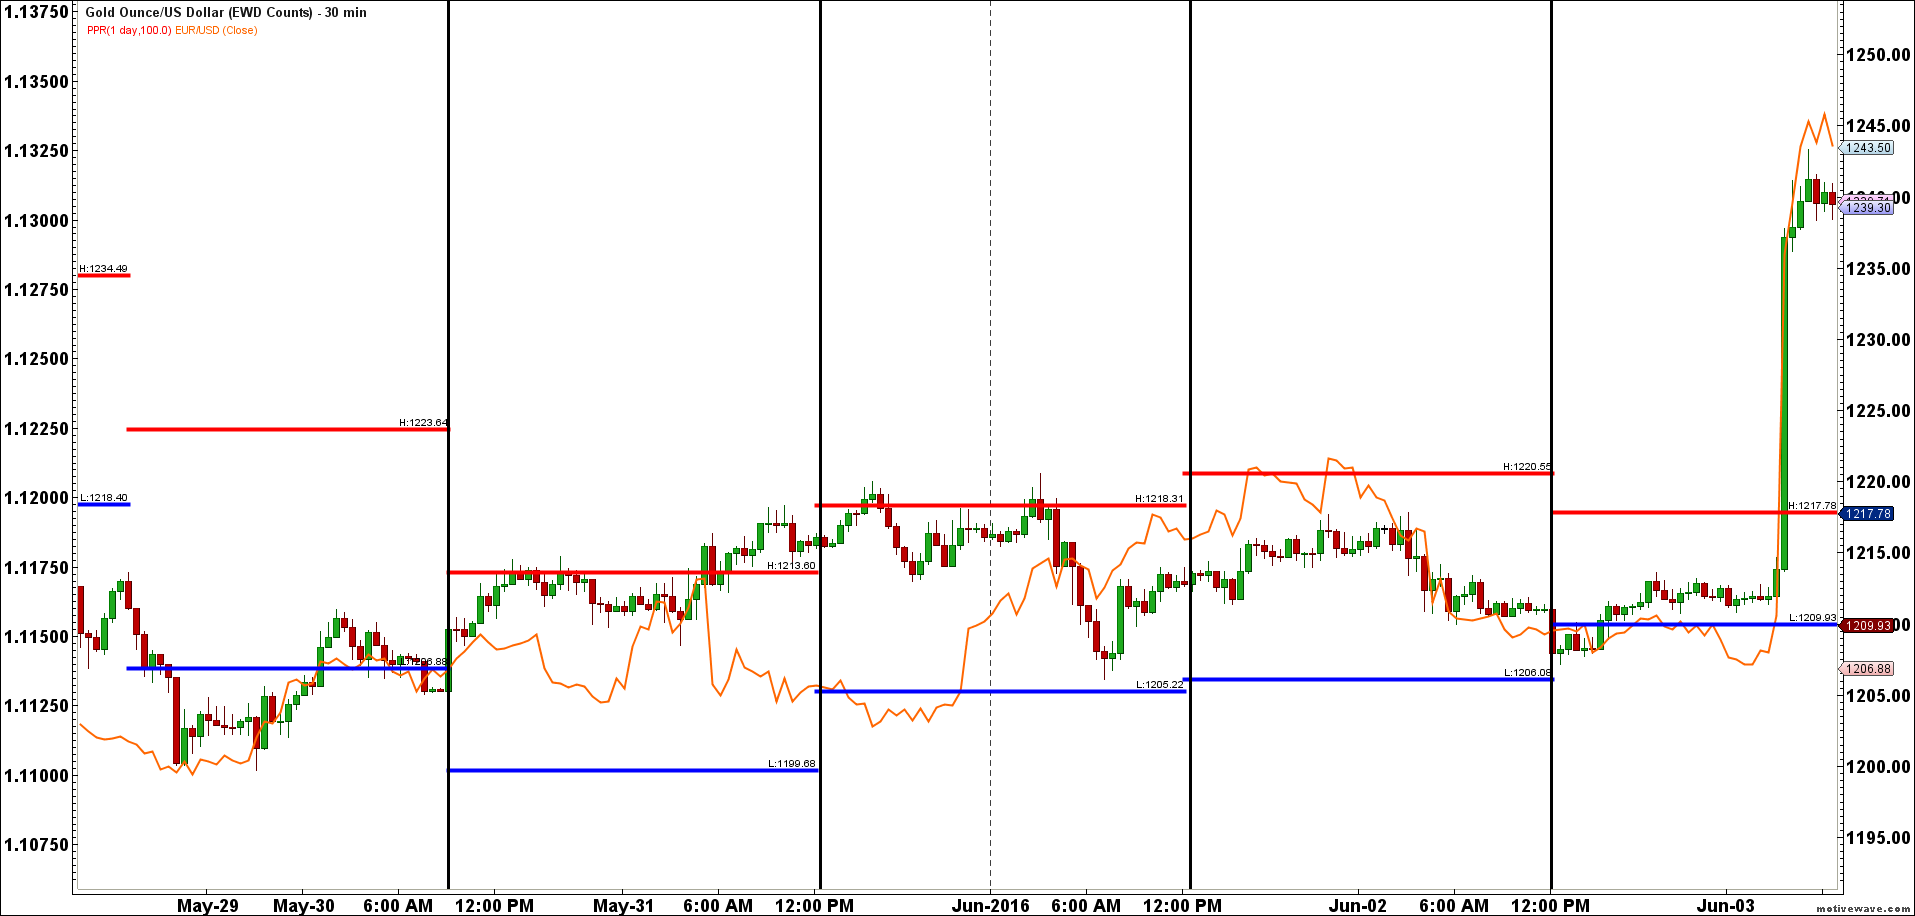
Gold had been on a nasty drought over the last few weeks, but finally saw some strong gains following the weak jobs report. Given the selloff in the US dollar, gold managed to see inflows as investors started pouring in money with the expectations of a delayed rate hike. Looking at gold for the last 5 days with the EUR/USD plotted as an overlay, one can readily see the inverse relationship between gold and the dollar. (EUR/USD is perfectly correlated with gold).
S&P 500
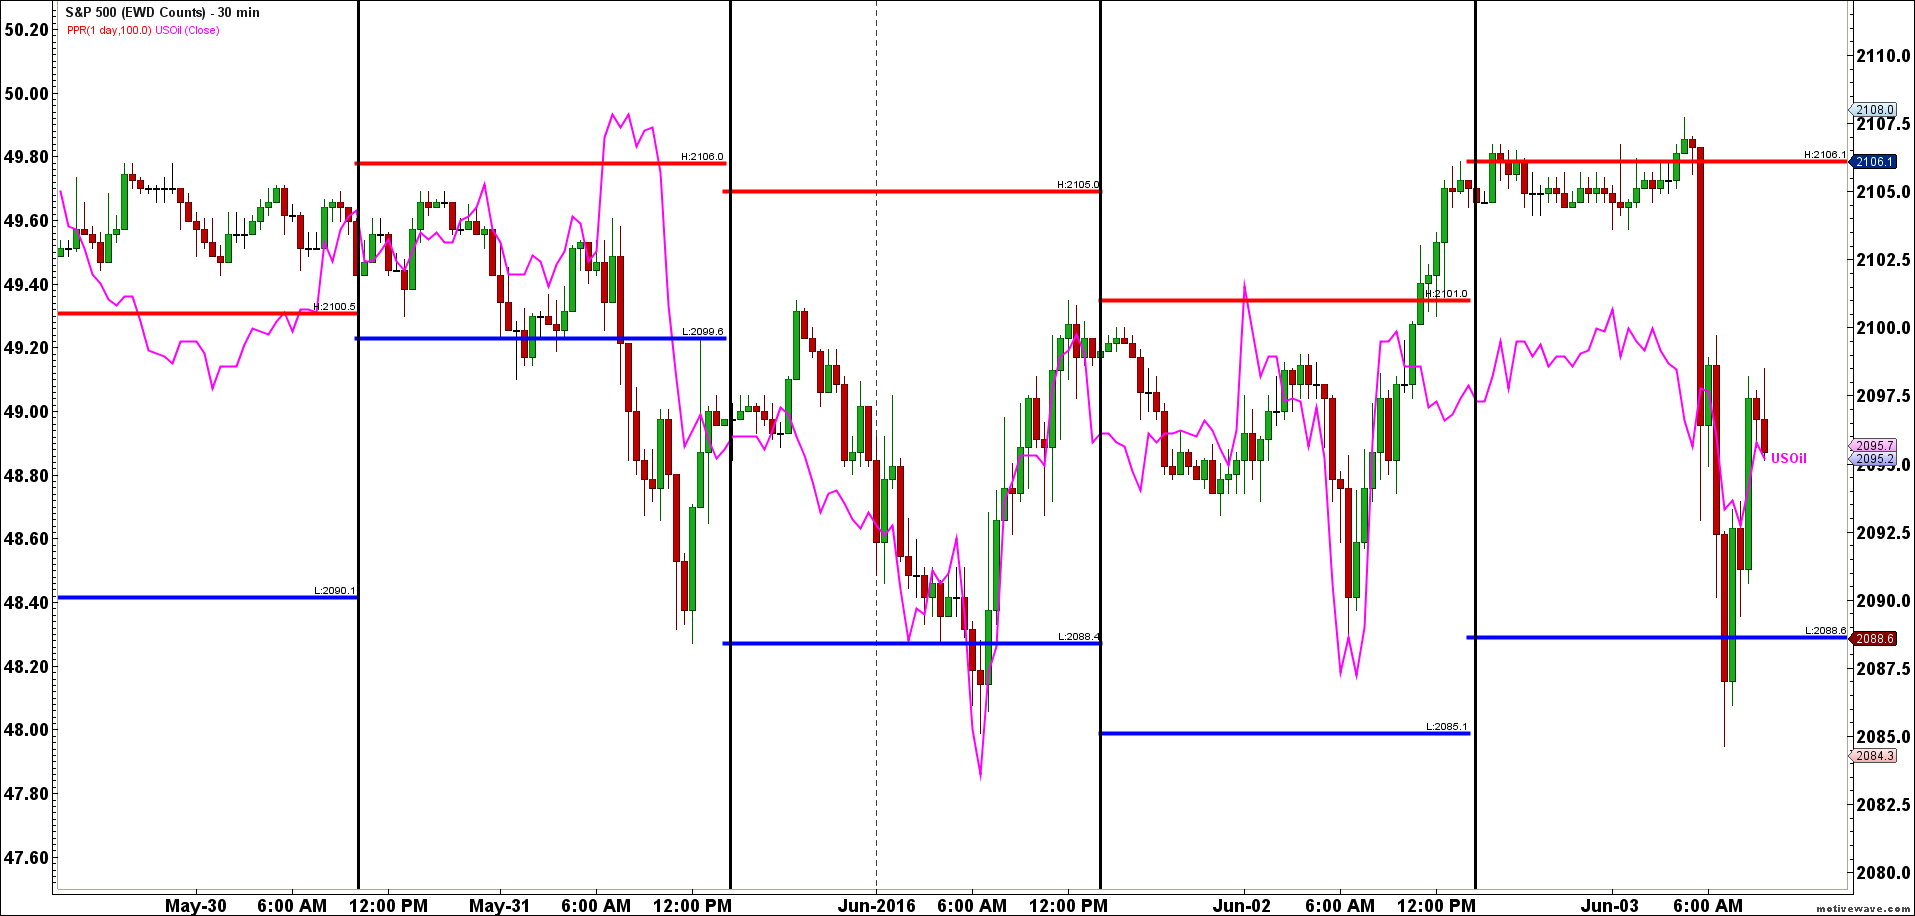
Finally, the S&P 500 followed oil all week long once again as shown in the chart below. After the horrible jobs report, the S&P 500 slid almost 20 points lower to reach 2,085 before reversing to finish the week at 2,097. From an Elliott Wave perspective, the S&P 500 is trading in a choppy downtrend within the downtrend channel. (See video for Wave Count).
