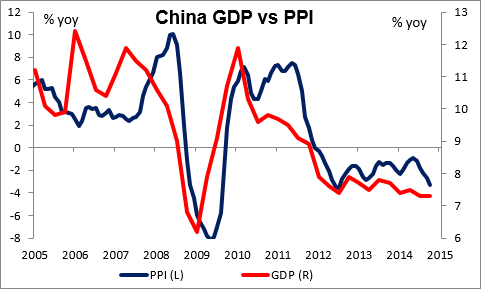
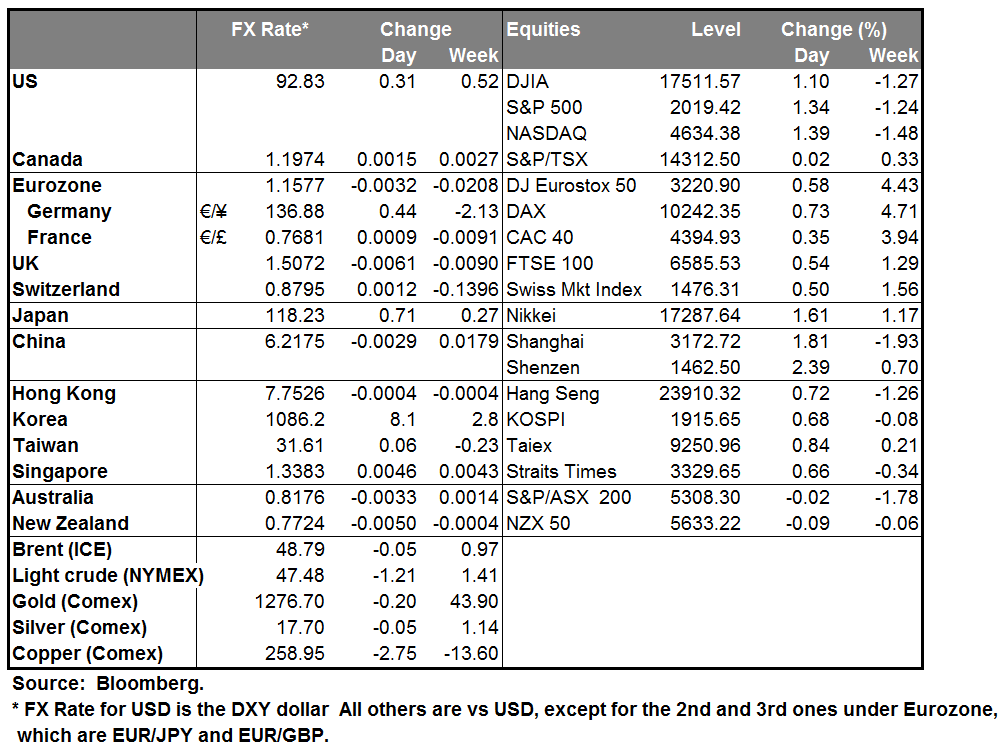
GDP rescues China stocks, but probably not Chinese inflation Chinese stocks cratered Monday, with the Shanghai Composite index falling 7.7% as the securities regulators tightened up on margin accounts. But stocks bounced back today after the government announced that GDP rose 7.4% for the year, a bit over estimates of 7.3%. Retail sales for December were in line with expectations at 12% yoy and industrial production for the month beat estimates at 7.9% yoy. So all around good figures that have restored some confidence, along with comments by the regulators that they are not trying to suppress the stock market, just “protect investors’ rights and support the healthy growth of margin trading.” It’s remarkable that the authorities were almost able to hit their 7.5% GDP target while continuing reform measures aimed at the shadow banking system, local government finance and the property market. Nonetheless it’s clear that the momentum of growth is slowing, and with producer prices strongly in deflationary territory, the deflationary impulse emanating from China is not likely to abate any time soon. So while Chinese stocks may be recovering, China’s impact on global monetary policy is likely to continue to be negative. We are still likely to see “currency wars” caused by domestic monetary policy spillover into the international arena this year.
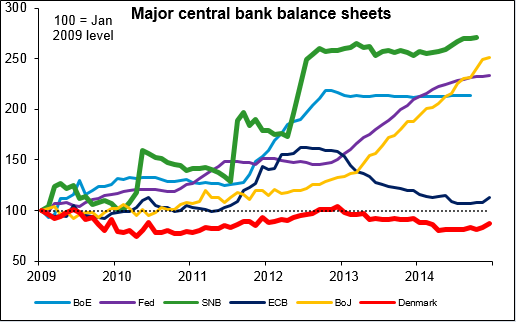
Pressure on DKK peg The Swiss National Bank’s (SNB) surprise end to the EUR/CHF floor last week has put pressure on the Danish krone (DKK), which is pegged to the EUR in a ±2.25% band around 7.46038. Denmark yesterday cut its interest rates 15 bps to defend the peg, with the deposit rate falling deeper into negative territory to -0.2% and the lending rate now just barely positive at 0.05%. Denmark had a current account surplus of 7.2% of GDP last year and a budget deficit of 0.75% of GDP, tiny by European standards. With its AAA-bond rating, it’s no wonder the country has an appreciating currency. Could its peg be in danger too? It’s possible, but less likely than Switzerland. First off, the DKK peg has been in place for over 30 years (it was first pegged to the Deutschemark in 1982), vs less than four years for CHF. Secondly, Denmark hasn’t seen the kind of inflows that Switzerland has an accordingly, the Danish central bank’s balance sheet hasn’t ballooned like the SNB’s has. So while I would expect the DKK to come under further upward pressure, I do not expect them to abandon their peg, which the Economy Minister said was “secure.” I admit though that I didn’t expect the SNB to abandon its peg, either.
Dollar generally higher Overall: the dollar was generally higher this morning in Europe, gaining against all the G10 currencies except for a modest decline vs EUR. CHF was the weakest of the G10 currencies as the market continues to struggle to find an equilibrium level for the Swiss currency now. At this morning’s EUR/CHF level of 1.0181 it is around the bottom of what one academic paper* last October said would be the EUR/CHF range derived from options contracts: 1.01-1.18. So perhaps it is now back to the minimum of what the market had previously thought to be “fair value” for the pair. I expect EUR/CHF to rise somewhat further towards the middle of the range, which would be around 1.095. That would make for USD/CHF around 0.93, assuming that EUR/USD stays constant – which I don’t assume. If EUR/USD moved to 1.14, then EUR/CHF at 1.08 would mean USD/CHF at 0.95. In short, it’s going to be a struggle for USD/CHF to regain parity.
Today’s highlights: During the European day, German PPI for December is expected to slip further into deflation, showing that the deflationary pressures in the eurozone are increasing. German ZEW survey for January is also to be released. Even though this could be the third consecutive rise in the indices, it may not be enough to reverse the negative sentiment towards EUR. The pressure on the common currency has been intensified after the SNB’s unexpected move last Thursday to remove the EUR/CHF floor fed speculation that the ECB must be preparing something gigantic.
From Canada, we get manufacturing sales for November.
In the US, the only indicator we get is the NAHB housing market index for January, which is expected to show a small improvement.
In New Zealand, the Q4 inflation rate is expected to decline to 0.9% qoq from 1.0% qoq in Q3. Last time, NZD/USD dropped approximately 50 pips after Q3 inflation declined to the lower boundary of the RBNZ’s range target of 1%-3% over the medium term. Even though the decline suggests less pressure for the RBNZ to resume raising rates, at their last meeting the Bank stated that the next move in rates was likely to be up. However, if the CPI rate falls below the lower boundary they may change their stance and return to neutral.
As for the speakers, BoE Deputy Governor Jon Cunliffe and Fed Governor Jerome Powell speak.
The Market
EUR/USD finds resistance near 1.1650
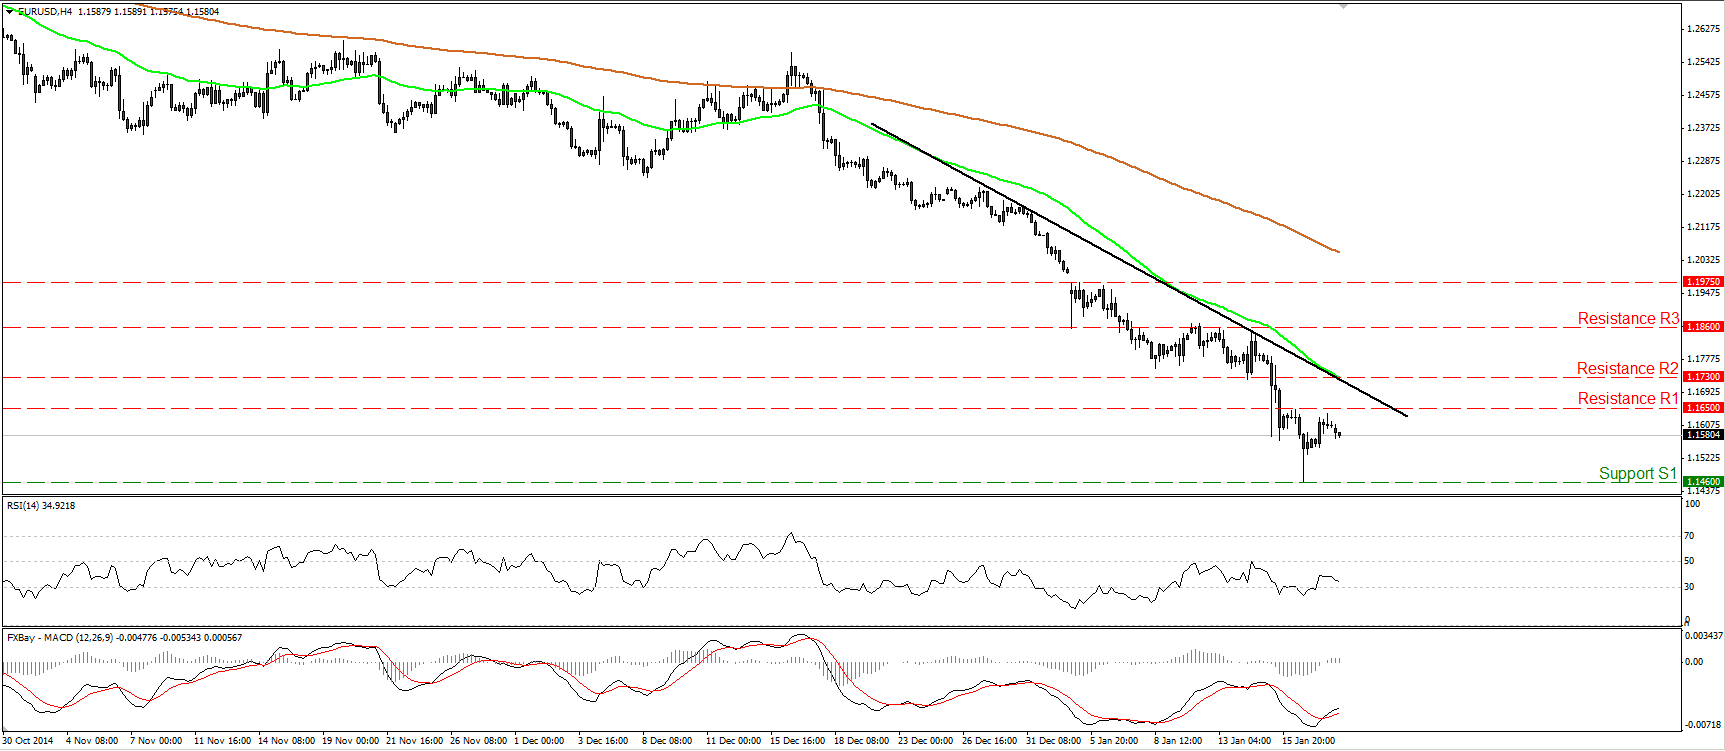
EUR/USD rebounded on Monday, but after hitting resistance fractionally below the 1.1650 (R1) hurdle, it retreated somewhat. In my view, the short-term bias remains to the downside and thus I believe that the forthcoming wave is likely to be to the downside, perhaps for another test at the 1.1460 (S1) line. If the bears are strong enough to drive the battle below 1.1460 (S1), I would expect them to pull the trigger for the 1.1370 (S2) hurdle, defined by the low of the 7th of November 2003. Our daily oscillators detect accelerating bearish momentum and amplify the case for further declines. The 14-day RSI stays within its oversold territory and is pointing down, while the daily MACD stands below both its zero and signal lines, pointing south as well. As for the overall trend, on the daily chart, the price structure still suggests a downtrend. The pair is forming lower peaks and lower troughs below both the 50- and the 200-day moving averages.
• Support: 1.1460 (S1), 1.1370 (S2), 1.1225(S3)
• Resistance: 1.1650 (R1), 1.1730 (R2), 1.1860 (R3)
AUD/USD declines after hitting resistance at 0.8255
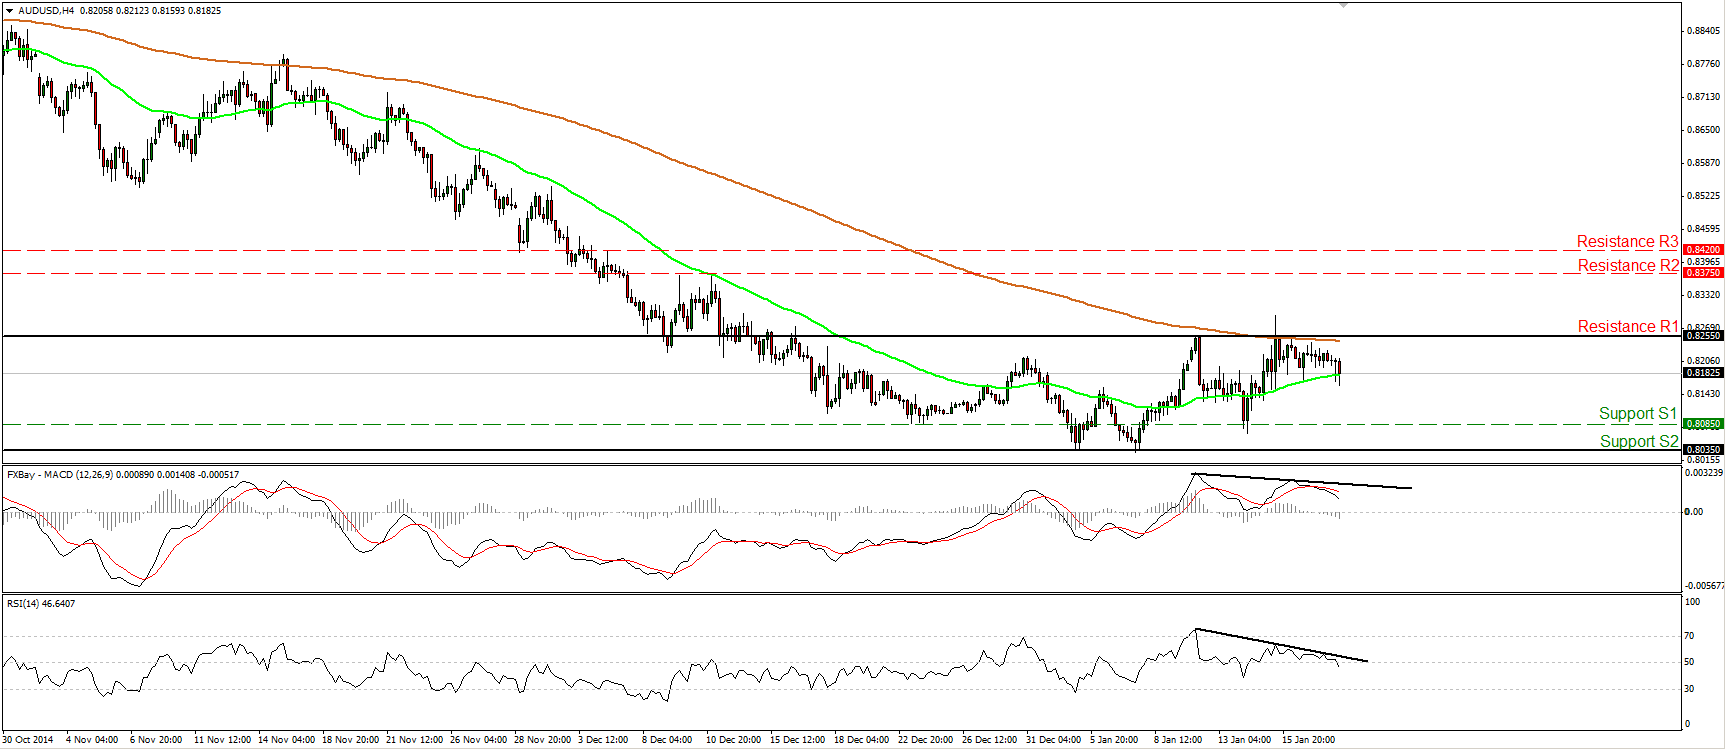
AUD/USD moved lower after hitting the upper bound of a sideways range it’s been trading since the middle of December. Given that and also having in mind our short-term momentum signs, I would expect the downside wave to continue, perhaps for a test near the 0.8085 (S1) line. The RSI dipped below its 50 line and is pointing south, while the MACD, although positive, topped and fell below its signal. There is also negative divergence between both these indicators and the price action. On the daily chart, the rate is trading below both the 50- and the 200-day moving averages, and this keeps the overall downtrend intact in my view. Nevertheless, the short-term pause and the lack of downside momentum is also confirmed by our daily oscillators. The 14-day RSI edged higher to hit its 50 line, while the daily MACD stands above its trigger and is in a rising mode.
• Support: 0.8085 (S1), 0.8035 (S2), 0.8000 (S3)
• Resistance: 0.8225 (R1), 0.8375 (R2), 0.8420 (R3)
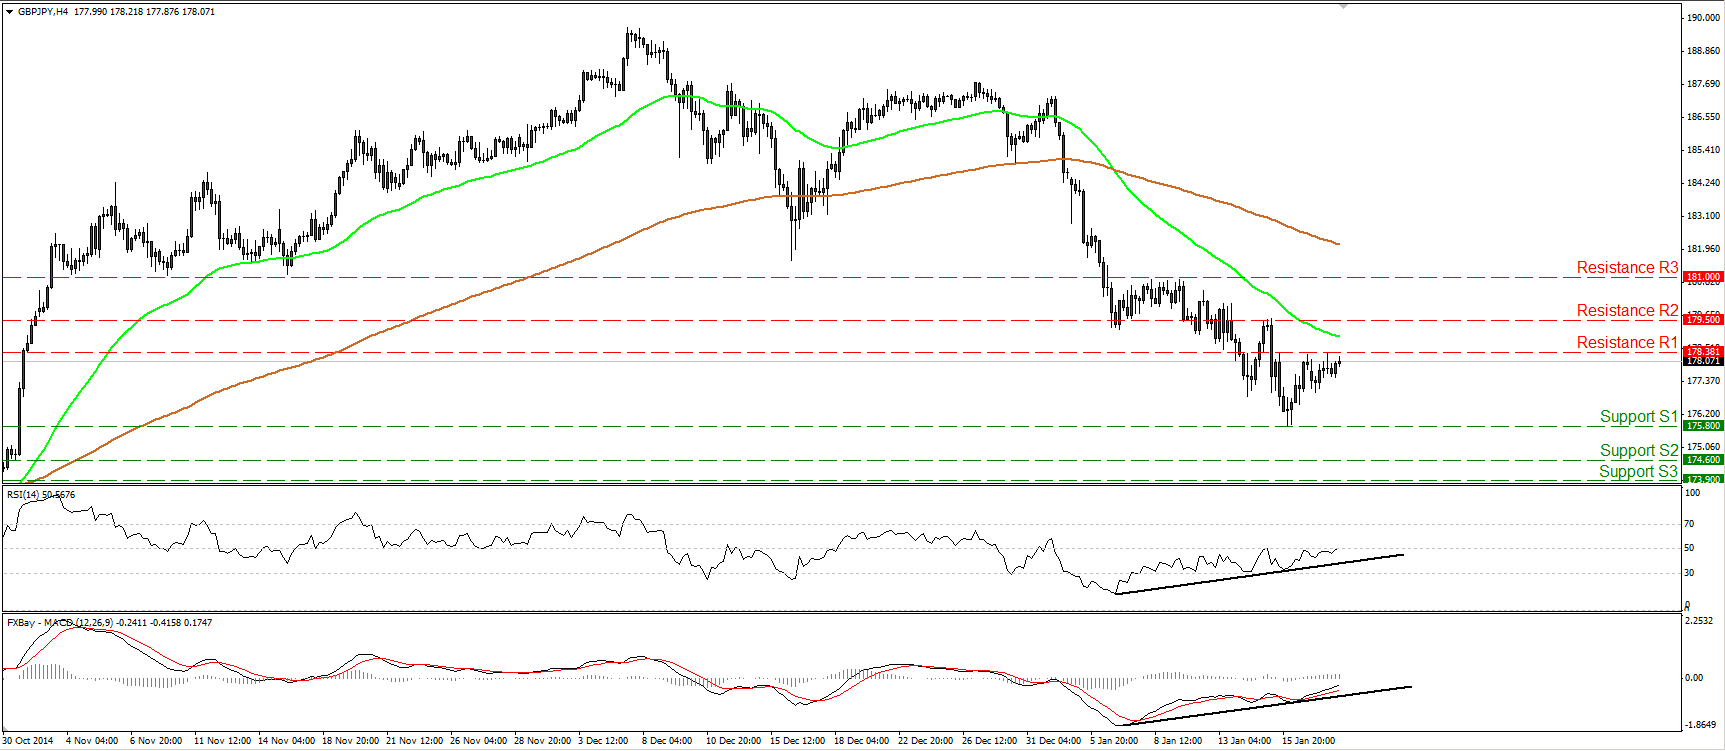
GBP/JPY rebounds from 175.80
GBP/JPY rebounded after finding support near 175.80 (S1) to trade fractionally below the 178.40 (R1) line. Although the price structure still suggests a short-term downtrend, our momentum studies detect that this trend is running out of momentum. There is positive divergence between both our oscillators and the price action. Moreover, the RSI poked its nose above its 50 line, while the MACD stands above its trigger, approaching its zero line. On the daily chart, the picture stays cautiously negative, but our daily momentum studies shows signs that further upside correction could be looming. The 14-day RSI exited its oversold territory and is now pointing up, while the daily MACD shows signs of bottoming.
• Support: 175.80 (S1), 174.60 (S2), 173.90 (S3)
• Resistance: 178.40 (R1), 179.50 (R2), 181.00 (R3)
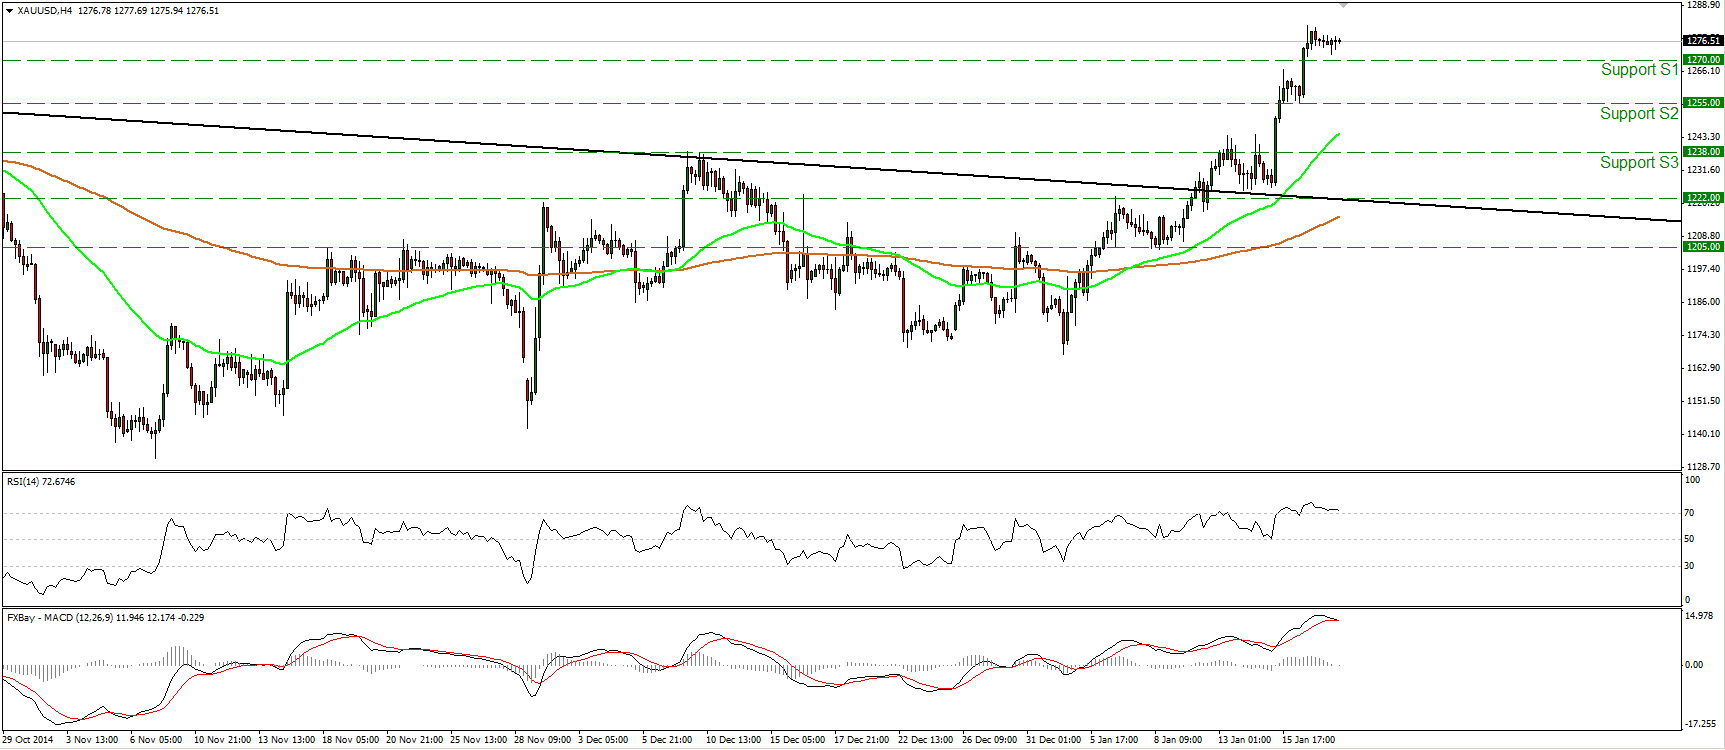
Gold trades in a consolidative manner
Gold moved in a consolidative manner on Monday, staying above the support hurdle of 1270 (S1). The bias remains to the upside and therefore I still expect a test near the round figure of 1300 (R1). Nevertheless, taking a look at our near-term oscillators, I remain concerned about a possible pullback before the longs seize control again. The RSI lies within its overbought territory near its 70 line, while the MACD has topped and could dip below its signal line any time soon. On the daily chart, the metal edged higher after completing an inverted head and shoulders formation on the 12th of January, and this holds the picture positive.
• Support: 1270 (S1), 1255 (S2), 1238 (S3)
• Resistance: 1300 (R1), 1320 (R2), 1340 (R3)
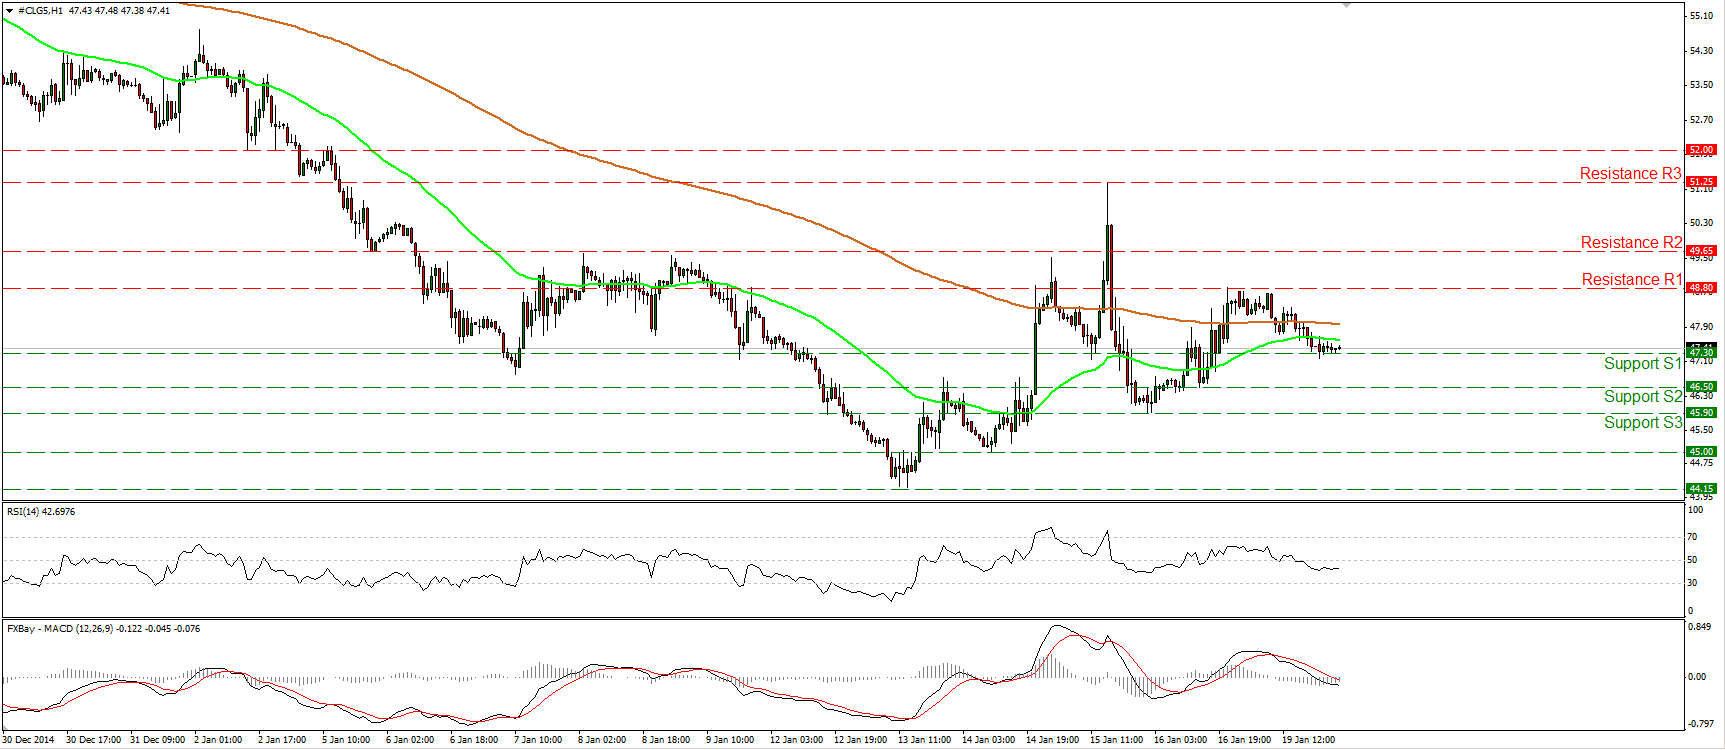
WTI slides after finding resistance at 48.80
WTI slid yesterday, after finding solid resistance at the 48.80 (R1) line and printed a lower high. Today, during the early European morning, WTI settled near 47.30 (S1). Given that I don’t see a clear trending structure on the 1-hour chart now, I will hold a neutral stance as far as the short-term picture is concerned. On the daily chart, WTI is still printing lower peaks and lower troughs below both the 50- and the 200-day moving averages, and this keeps the overall downtrend intact. However, the 14-day RSI exited its oversold field, while the daily MACD, although negative, stays above its trigger line and is pointing north. There is also positive divergence between both the oscillators and the price action. These signs give me additional reasons to sit on the sidelines, as further upside correction could be looming.
• Support: 47.30 (S1), 46.50 (S2), 45.90 (S3)
• Resistance: 48.80 (R1), 49.65 (R2), 51.25 (R3)

