Monitoring purposes SPX: Neutral
Monitoring purposes Gold: Long GDX (NYSE:GDX) on 4/14/16 at 21.60
Long-Term Trend monitor purposes: Short SPX on 1/13/16 at 1890.28

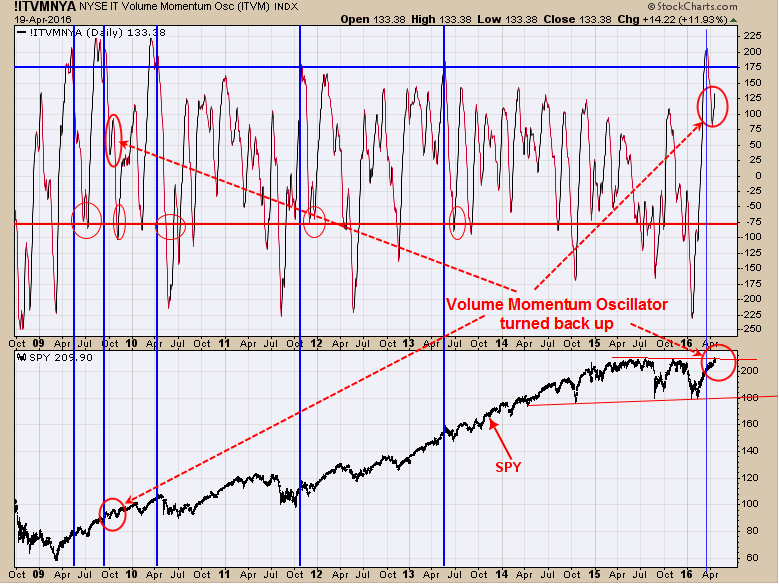
We showed this chart before - the Volume Momentum Oscillator. Readings above +175 suggests exhaustion for short term, which was reached over a week ago. The market has since moved modestly higher, and the Volume Momentum Oscillator has turned back up. A similar thing happened back in October 2009 (circled in red) and the market just traded sideways for a month or so. SPDR S&P 500 (NYSE:SPY) is up against the highs of 2015 and may provide resistance. So far the short-term measures remain positive. We will remain neutral for now.

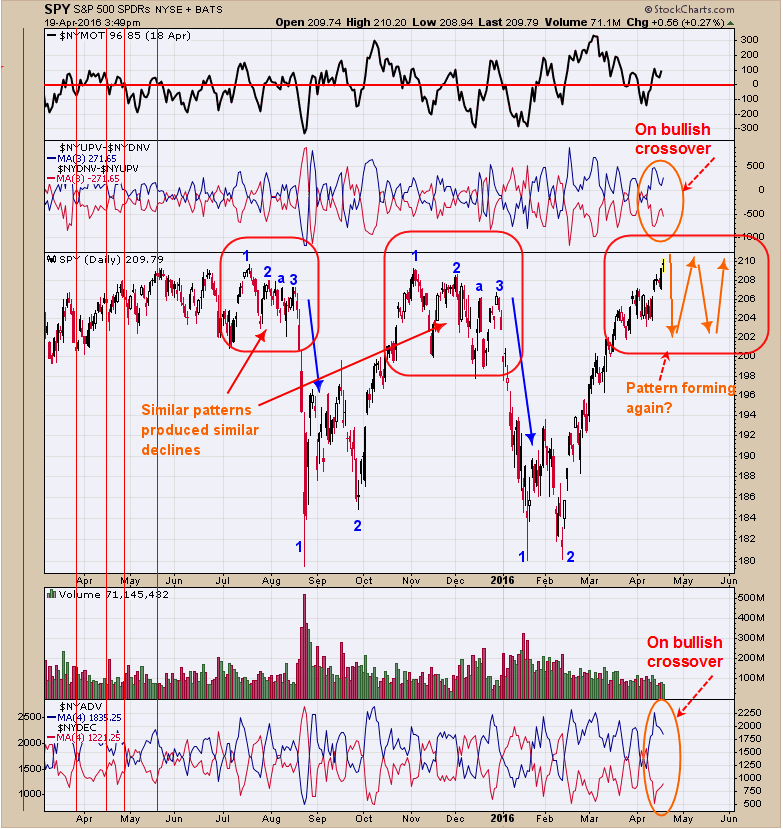
The pattern that formed back in mid-July to mid-August 2015 was very similar to the pattern that formed from November to December 2015, and both produced similar declines that produced a double bottom. Right now the market is testing the 210 level on the SPY the third time. Our thinking is that the same pattern could form again that formed in mid-July to mid-August and November, December timeframe. It's too soon to notice any similarities as the market is still pushing higher. We do have measures suggesting a top is not far off. For the very short term, the up/down volume / down/up volume is on a bullish crossover (second window down from top) and advancing issues/declining issues are on a bullish crossover (bottom window), and the McClellan oscillator remains above “0” and all are bullish for now.

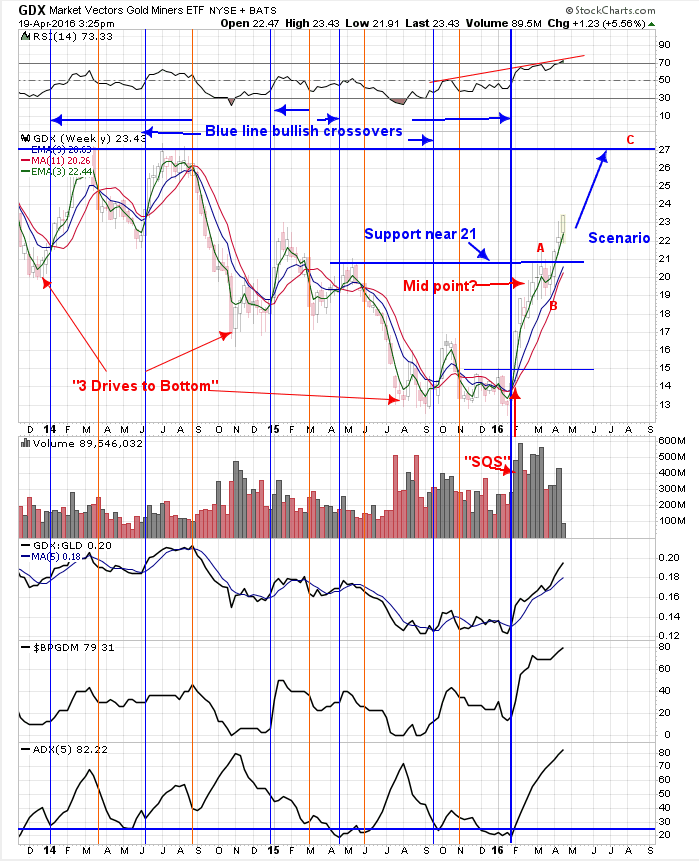
The gold commercials came in at -231,787 contracts as of 4/15/16; previous week reading was minus 207,245 contracts. Though gold may stubble short term, the gold stocks may stay strong. Yesterday we showed the monthly Market Vectors Gold Miners (NYSE:GDX) chart, which is on a bullish crossover for the 11, 9 and 3 period moving averages. Above is the weekly GDX chart which is also on a bullish crossover for the 11, 9 and 3 period moving averages. These three moving averages on the monthly and weekly timeframes had a bullish crossover on the close of February 2016. We have on previous reports discussed the possible “three drives to bottom” pattern forming on the monthly and weekly timeframes for GDX, and it appears to be in play, which has an upside target near the 27.00 range and our target for now. The top window is the weekly RSI and so far is not showing a divergence, suggesting the rally has further to go. Long GDX at 21.60 on 4/14/16.
