Just before the Thanksgiving holiday, the National Association of Active Investment Managers (NAAIM) exposure index was sitting at its lowest point since February 2016, at 30.55. In other words, active money managers were very limited in their overall equity exposure, as the S&P 500 Index (SPX) was testing its October lows. However, NAAIM bulls have re-emerged with a vengeance, with the index more than doubling to 61.96 in the past two weeks -- something we haven't seen in more than three years.
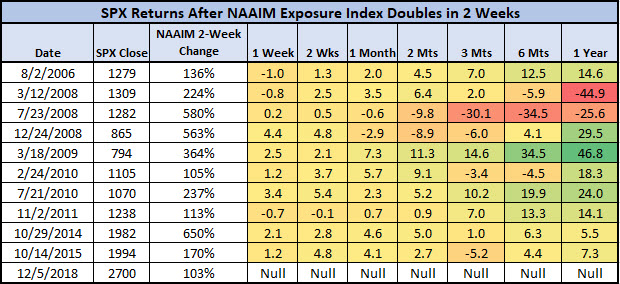
There have been just 11 signals of this kind since 2006, considering one signal every month, per Schaeffer's Quantitative Analyst Chris Prybal. Specifically, the last time the NAAIM index jumped 100% or more in two weeks was in October 2015. Prior to that, you'd have to go back to October 2014, when the index skyrocketed 650%. Of note, this signal also flashed in March 2009, what we now know was the start of a years-long bull run.

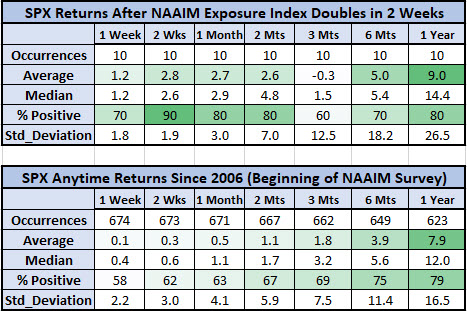
Historically, a notable rush of reinvigorated NAAIM bulls has preceded strong S&P 500 returns. A week after signals, the SPX was up 1.2%, on average, and was higher 70% of the time. That's more than 10 times the index's average anytime one-week return of 0.1%, looking at data since 2006. Two weeks out, the S&P was up an impressive 2.8%, on average, and was higher 90% of the time. That's compared to an average anytime one-week return of just 0.3%, with a 62% positive rate.
One and two months out, it's a similar story. The S&P was up an average of 2.7% and 2.6%, respectively, and was higher 80% of the time after signals. That's far better than its average anytime returns for both time frames. Six months and a year later, the index also generated bigger-than-usual average gains of 5% and 9%, respectively. Plus, those returns would be much larger, if not for the 2008 signals (of which there are three), when the stock market was in the throes of the financial crisis.
The lone outlier is the three-month marker, with the index down an average of 0.3%, and higher just 60% of the time. That's mostly due to the steep 30.1% loss suffered after the July 2008 signal.

In conclusion, these NAAIM signals have preceded big rallies for the S&P historically, with the exception of the intermediate-to-long-term returns during the financial crisis. However, the stock market's trajectory after the most recent signal will likely be determined by the S&P 500's price action around a pair of key long-term moving averages, per Schaeffer's Senior V.P. of Research Todd Salamone.
