
Never sell a covered call option or cash-secured put if there is an earnings report due out prior to contract expiration. This is one of the golden rules of the BCI methodology. We know that a report that disappoints generally did not meet market consensus regarding sales, earnings or both. However, the report still may have reflected great corporate performance aside from not meeting analyst expectations. This article will highlight such a scenario with Facebook, Inc (NASDAQ:FB) which dropped $10.00 in value after the November 2nd, 2016 earnings release.
Technical chart

FB Chart before and After a Disappointing Earnings report
The brown field highlights a drop in share price from $129.00 to $119.00 resulting from the report that did not meet market expectations. The blue arrow points to the bearish moving average crossover which occurred shortly after the price decline. What we have here is a company that is generating huge revenues and profits but a bearish technical chart. Following our earnings report rule, BCI members moved out of FB prior to the report but can now re-enter at a lower price point if the assessment is that of an opportunity despite the technical breakdown. Many BCI members did exactly that.
Options chain as of 12/21/2016
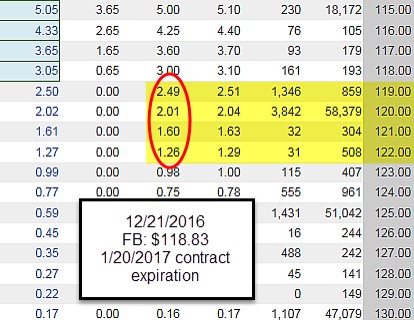
FB Options Chain for the 1/20/2017 Expiration
A bullish outlook on FB will guide us to out-of-the-money strikes, highlighted in the yellow field. The more bullish we are on the overall market and the stock, the deeper out-of-the-money strikes should be favored. Let’s feed these stats into the multiple tab of the Ellman Calculator.
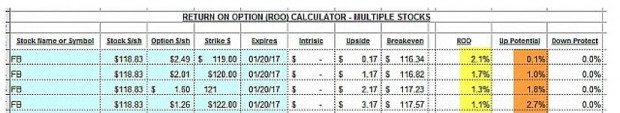
The Ellman Calculator: FB
The ROO (return on options) ranges from 1.1% to 2.1% for the one month. The upside potential ranges from 0.1% to 2.7%. The $122.00 strike offers the greatest 1-month potential return of 3.8% (1.1% + 2.7%).
Price action post report

FB Chart After Disappointing Earnings Report
After a brief period of consolidation (blue arrow), FB has been in a strong bullish price pattern (red arrow).
Discussion
A disappointing earnings release can create a bearish technical chart for an otherwise elite-performing security. Frequently, the report was impressive but fell short of market expectations. Buying the stock after the share decline and favoring out-of-the-money strikes when we anticipate price recovery is a choice available to us. An excellent free resource for stock news including earnings reports information is finviz.com.
Market tone
Global stocks remain unchanged on the week. The price of West Texas Intermediate crude oil declined to $44.70 from $45.50 last Friday. Volatility, as measured by the Chicago Board Options Exchange Volatility Index (VIX), moved up to 10.38 from 10.0 a week ago. This week’s economic and international news of importance:
- Despite falling inflation data in recent months, the US Federal Reserve hiked rates on Wednesday, and indicated it will likely hike rates once more this year
- The central bank laid out the framework it will use when it begins to shrink its massive balance sheet later this year
- Fed chair Janet Yellen chalked up the recent decline in inflation to factors such as falling prices for cell phone service and prescription drugs
- Despite three consecutive monthly declines in consumer prices, the Federal Open Market Committee said that it expects inflation to stabilize around the committee’s 2% target in the medium term
- Despite three rates hikes, yields on U.S. 10-Year notes are nearly a half-percent lower today than they were when the FOMC resumed its tightening cycle in December 2016
- French president Emmanuel Macron’s Republic on the Move party is set to secure a significant majority in the National Assembly
- Credit rating agency Moody’s Investors Service warned this week that the minority government resulting from the recent snap election in the United Kingdom further complicates Brexit negotiations with the European Union
- The International Monetary Fund raised its gross domestic product forecast for China to 6.7% in 2017, up from its prior 6.6% projection
- Greece’s creditors reached another deal to release a further round of funding to keep the country afloat
- The Trump administration announced a revised Cuba policy on Friday that will tighten rules on Americans traveling to Cuba and restrict US companies from doing business with entities controlled by the Cuban military. Exceptions will be made for US air carriers and cruise lines
THE WEEK AHEAD
Sunday June 18th
- France: Final round – parliamentary elections
Monday June 19th
- United Kingdom Brexit negotiations commence
Wednesday June 21st
Thursday June 22nd
- US Leading economic indicators
Friday June 23rd
- Global Flash purchasing managers indices
- Canada Consumer price index
For the week, the S&P 500 moved up by 0.06% for a year-to-date return of 8.68%.
Summary
IBD: Uptrend under pressure
GMI: 4/6- Buy signal since market close of April 21, 2017 (as of Friday morning)
BCI: I am fully invested in the stock portion of my portfolio currently holding an equal number of in-the-money and out-of-the-money strikes.
WHAT THE BROAD MARKET INDICATORS (S&P 500 AND VIX) ARE TELLING US
The 6-month charts point to a cautiously bullish outlook. In the past six months, the S&P 500 was up 7.5% while the VIX (10.38) moved down by 15%.