As of Friday June 5, the S&P 500 was up 42.8% since March 23. This 52-day melt-up is historic. It is the largest since bigger gains in August-September 1932 (up as much as 109.2%) and May-June 1933 (up as much as 73.2%).
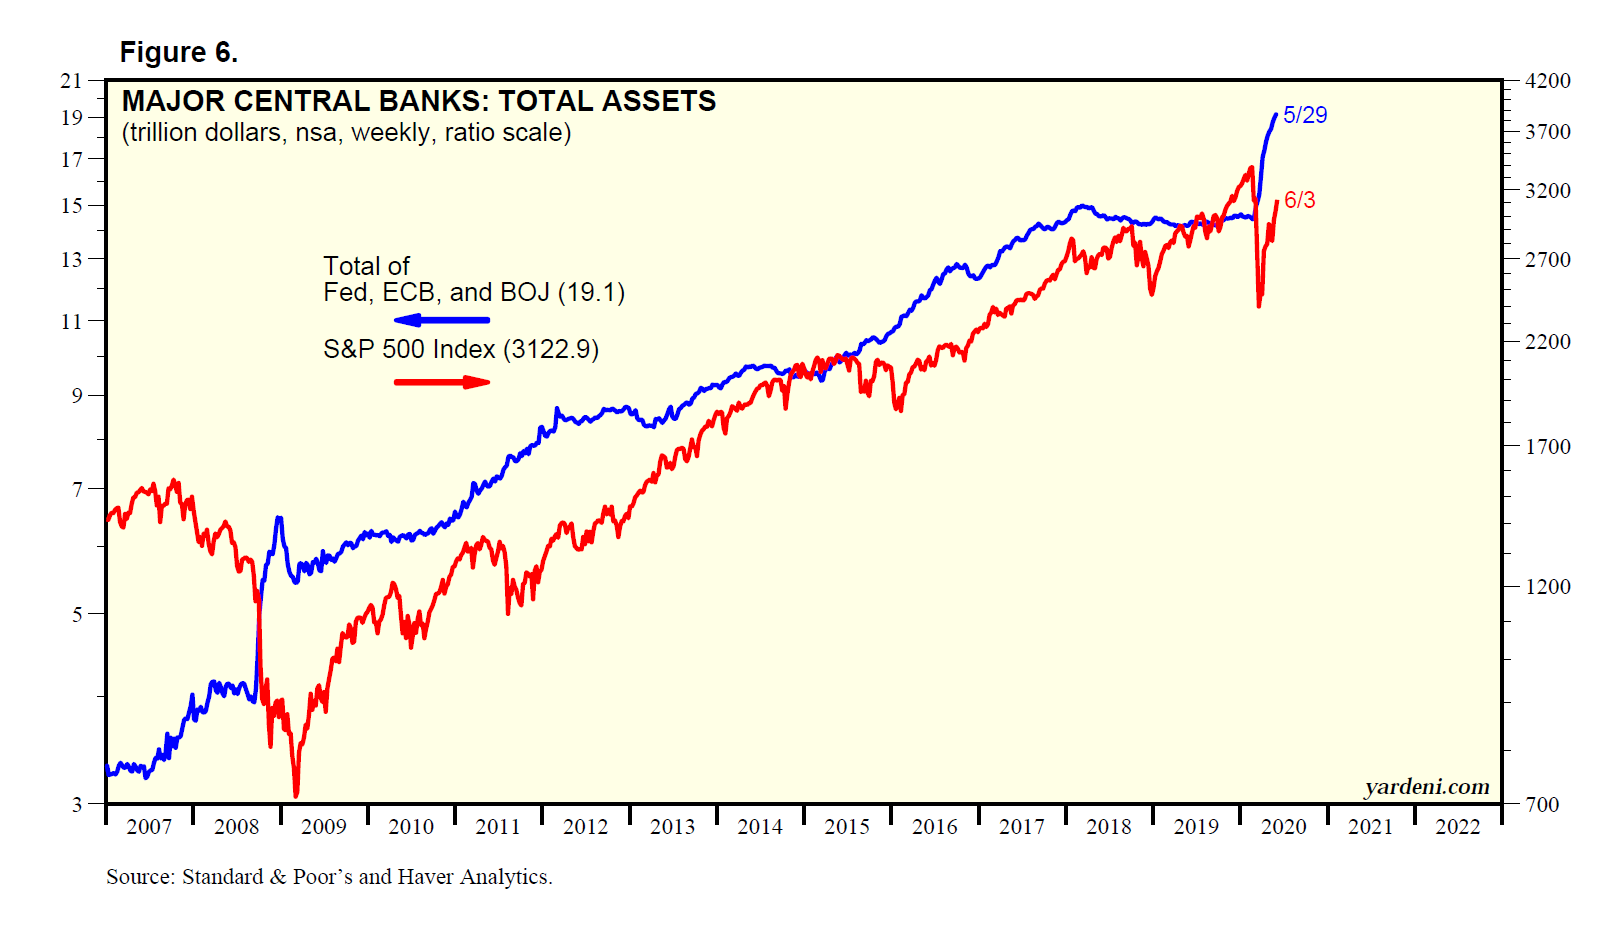
The melt-up started the day after March 23, when the Federal Reserve announced QE4Ever and started carpet-bombing the financial markets and the economy with B-52s full of cash (Fig. 1). Since then, the Fed’s balance sheet rose by $2.5 trillion to a record $7.1 trillion during the June 3 week (Fig. 2). Its holdings of Treasury securities increased $1.6 trillion over the same period to a record $4.1 trillion.

The Fed actually started its bombing campaign on March 15, when it announced $700 billion of QE4 purchases of US Treasuries and mortgage-backed securities and lowered the federal funds rate by 100bps to zero. The European Central Bank (ECB) joined the allied bombing campaign on March 18 with its Pandemic Emergency Purchase Programme (PEPP), committing to buy €750 billion of private- and public-sector Eurozone securities. On June 4, the ECB upped the ante by €600 billion to a total of €1,350 billion. The total assets of the Fed, ECB, and Bank of Japan have soared by $3.9 trillion from mid-March through the end of May to $19.1 trillion.
The result has been the Mother of All Meltups (MAMU).
During the bull market in stocks from 2009 through 2019, some bullish investment strategists claimed that “There Is No Alternative” to stocks. “TINA” was their stock market rallying cry. In fact, there was a good alternative to stocks, namely, bonds. The 10-year Treasury bond yield was 2.89% on March 9, 2009, when the previous bull market started. It fell to a record low of 0.54% on March 9 of this year.
TINA makes more sense during the current bull market than it did during the previous one. The embrace of Modern Monetary Theory (MMT) by US monetary and fiscal policymakers during the week of March 23, when the Fed announced QE4Ever, and on March 27, when the CARES Act was signed into law, triggered a huge wave of TINA rebalancing out of bonds and into stocks. It is likely to continue for the foreseeable future.
The stock market equation since March 23 has been: TINA + MMT = MAMU.
MMT ended the latest bear market, which lasted for just 33 calendar days from February 19 through March 23. During that period, there were 23 trading days, with the S&P 500 down by 20% or more during only seven of those days. Technically, it was still in bear market territory, as the S&P 500 rocketed 18.9% for 11 more trading days after the March 23 bottom, through April 7, before entering correction territory.
Nevertheless, I’m not convinced that the selloff should be classified as a bear market since it was so short. It was more like previous panic attacks during the bull market, which started on March 9, 2009. At the beginning of this year, on February 2, I added the COVID-19 outbreak as Panic Attack #66 on my list with a January 24 date, when the bad news first hit the tape. (See Table of S&P 500 Panic Attacks Since 2009.) It’s staying there in my record books!
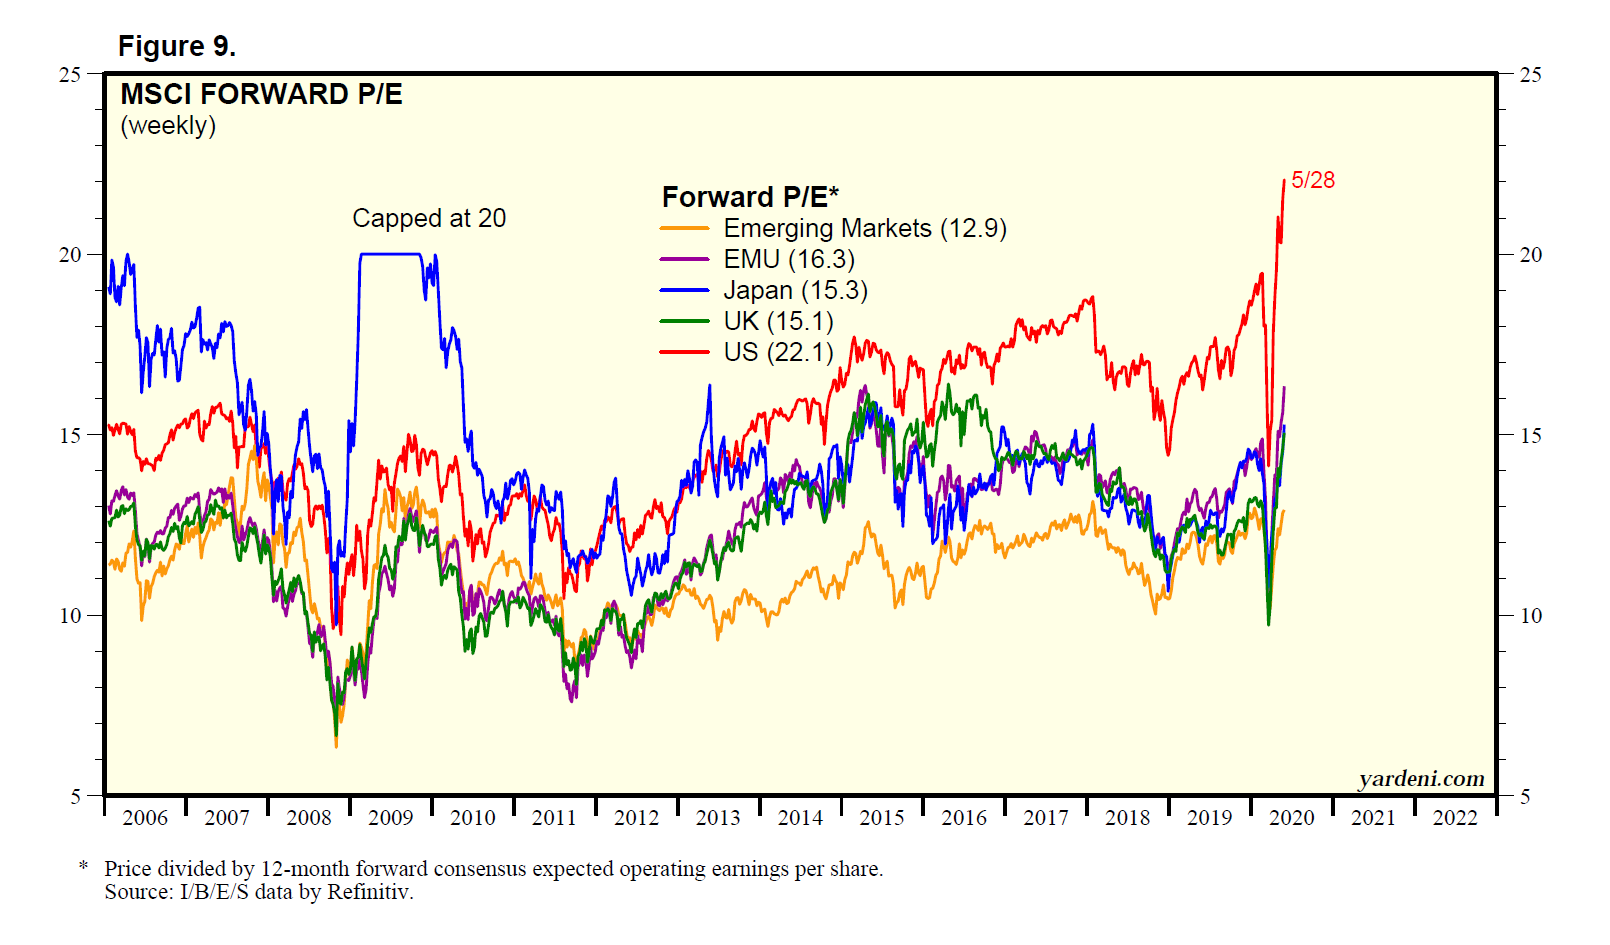
On Friday, the forward P/Es of the S&P 500, S&P (NYSE:SPY) 400, and S&P 600 jumped to 22.6, 23.1, and 26.1, respectively. Here’s the latest performance derby of the major MSCI stock price indexes since March 23 through Friday’s close in local currencies: US (43.6), All-Country World (37.4), EMU (35.2), Emerging Markets (28.5), UK (28.5), and Japan (25.4). Here are their forward P/Es on May 28: US (22.1), EMU (16.3), Japan (15.3), UK (15.1), and Emerging Markets (12.9).
Long live the bull market! Now we have to worry that MAMU might lead to its demise since melt-ups tend to be followed by melt-downs!

