Preface: Explaining our market timing models
We maintain several market timing models, each with differing time horizons. The "Ultimate Market Timing Model" is a long-term market timing model based on the research outlined in our post, Building the ultimate market timing model. This model tends to generate only a handful of signals each decade.
The Trend Model is an asset allocation model which applies trend following principles based on the inputs of global stock and commodity price. This model has a shorter time horizon and tends to turn over about 4-6 times a year. In essence, it seeks to answer the question, "Is the trend in the global economy expansion (bullish) or contraction (bearish)?"
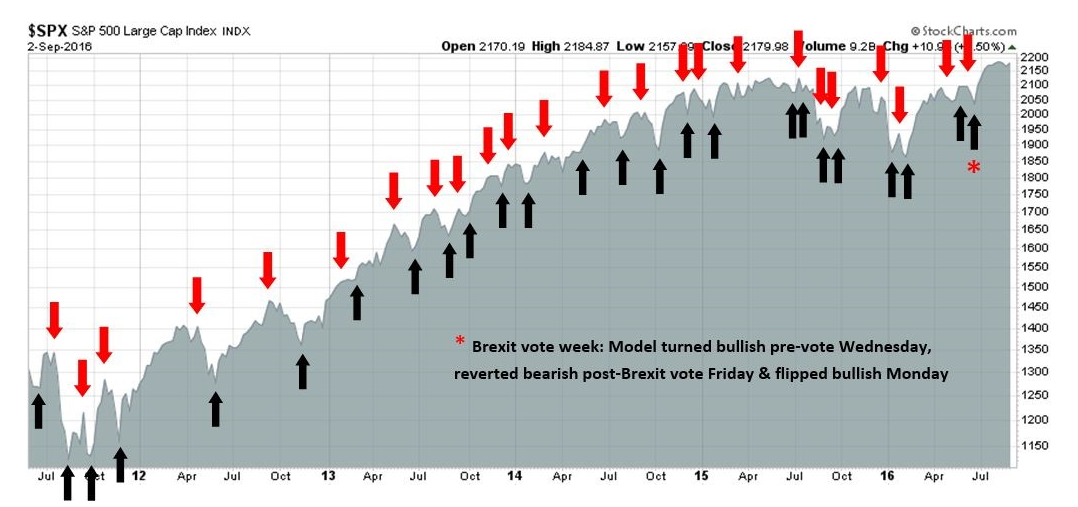
My inner trader uses the trading component of the Trend Model to look for changes in direction of the main Trend Model signal. A bullish Trend Model signal that gets less bullish is a trading "sell" signal. Conversely, a bearish Trend Model signal that gets less bearish is a trading "buy" signal. The history of actual out-of-sample (not backtested) signals of the trading model are shown by the arrows in the chart below. Past trading of the trading model has shown turnover rates of about 200% per month.
S&P 500 Chart:
The latest signals of each model are as follows:
- Ultimate market timing model: Buy equities*
- Trend Model signal: Risk-on*
- Trading model: Bullish*
The performance chart and model readings have been delayed by a week out of respect to our paying subscribers.
Update schedule: I generally update model readings on my site on weekends and tweet any changes during the week at @humblestudent. Subscribers will also receive email notices of any changes in my trading portfolio.
Weak macro = Weak stock market?
Friday's dismal market action got me thinking about the Black Knight scene in Monty Python's Holy Grail. Did his arm get chopped off, or was it just a "flesh wound"?
The macro data had been disappointing even before Friday's market downdraft, which undoubtedly contributed to the slightly sour tone in stock prices. The combination of disappointments in ISM Manufacturing and Services, a so-so Beige Book report, and softness in the Labor Conditions Market Index all contributed to the downbeat macro-economic momentum.
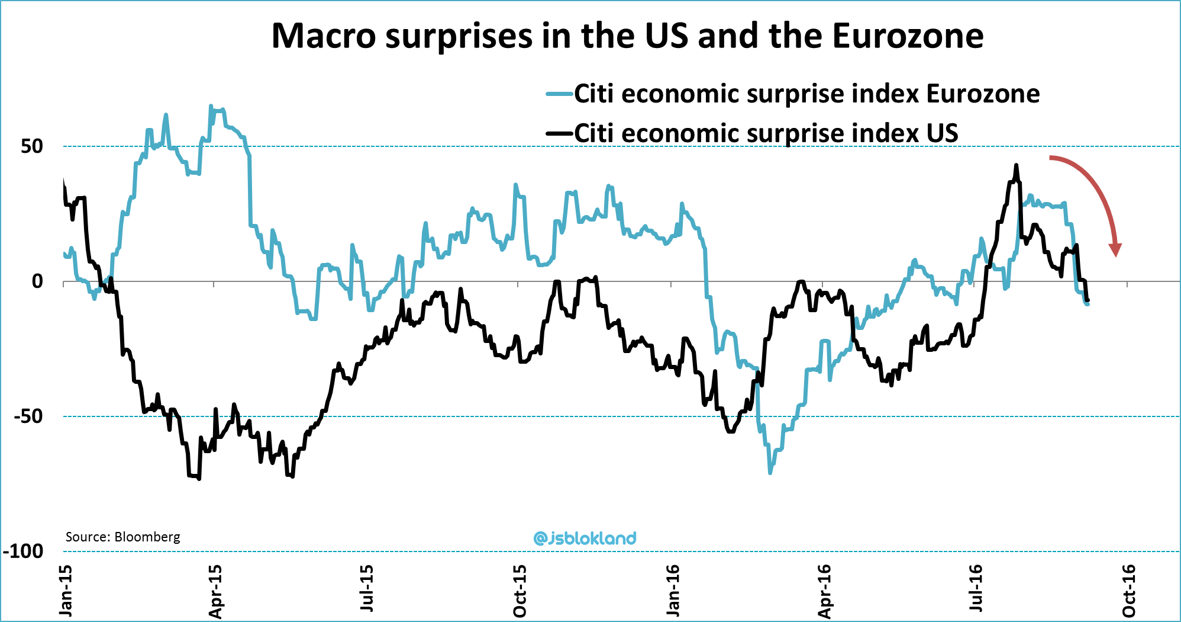
One key indicator of macro disappointment is the Citigroup Economic Surprise Index (ESI), which measures whether high frequency economic releases were beating or missing market expectations. As the chart below shows, ESI has been falling in the past few weeks on both sides of the Atlantic.

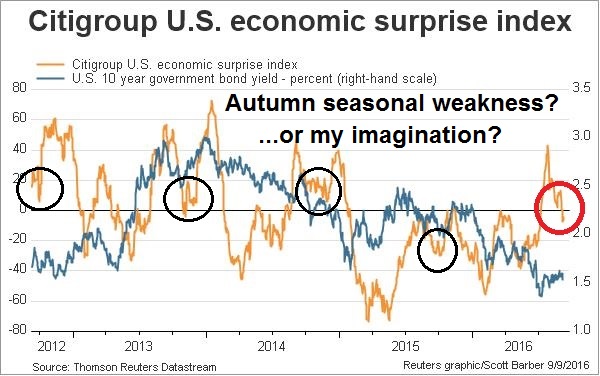
As a detailed examination of US ESI shows, there may be a seasonal pattern where the ESI weakens in the autumn and then recovers later. Or is that my imagination?

A case could be made that the dip in ESI is just a blip. A check of bottom-up fundamental indicators and technical market breadth shows that both of these other dimensions of market health are signaling further stock market gains. For now, I am inclined is to give the bull case the benefit of the doubt.
DISCLAIMER: Cam Hui is a portfolio manager at Qwest Investment Fund Management Ltd. (""Qwest""). This article is prepared by Mr. Hui as an outside business activity. As such, Qwest does not review or approve materials presented herein. The opinions and any recommendations expressed in this blog are those of the author and do not reflect the opinions or recommendations of Qwest. None of the information or opinions expressed in this blog constitutes a solicitation for the purchase or sale of any security or other instrument. Nothing in this article constitutes investment advice and any recommendations that June be contained herein have not been based upon a consideration of the investment objectives, financial situation or particular needs of any specific recipient. Any purchase or sale activity in any securities or other instrument should be based upon your own analysis and conclusions. Past performance is not indicative of future results. Either Qwest or Mr. Hui June hold or control long or short positions in the securities or instruments mentioned.
