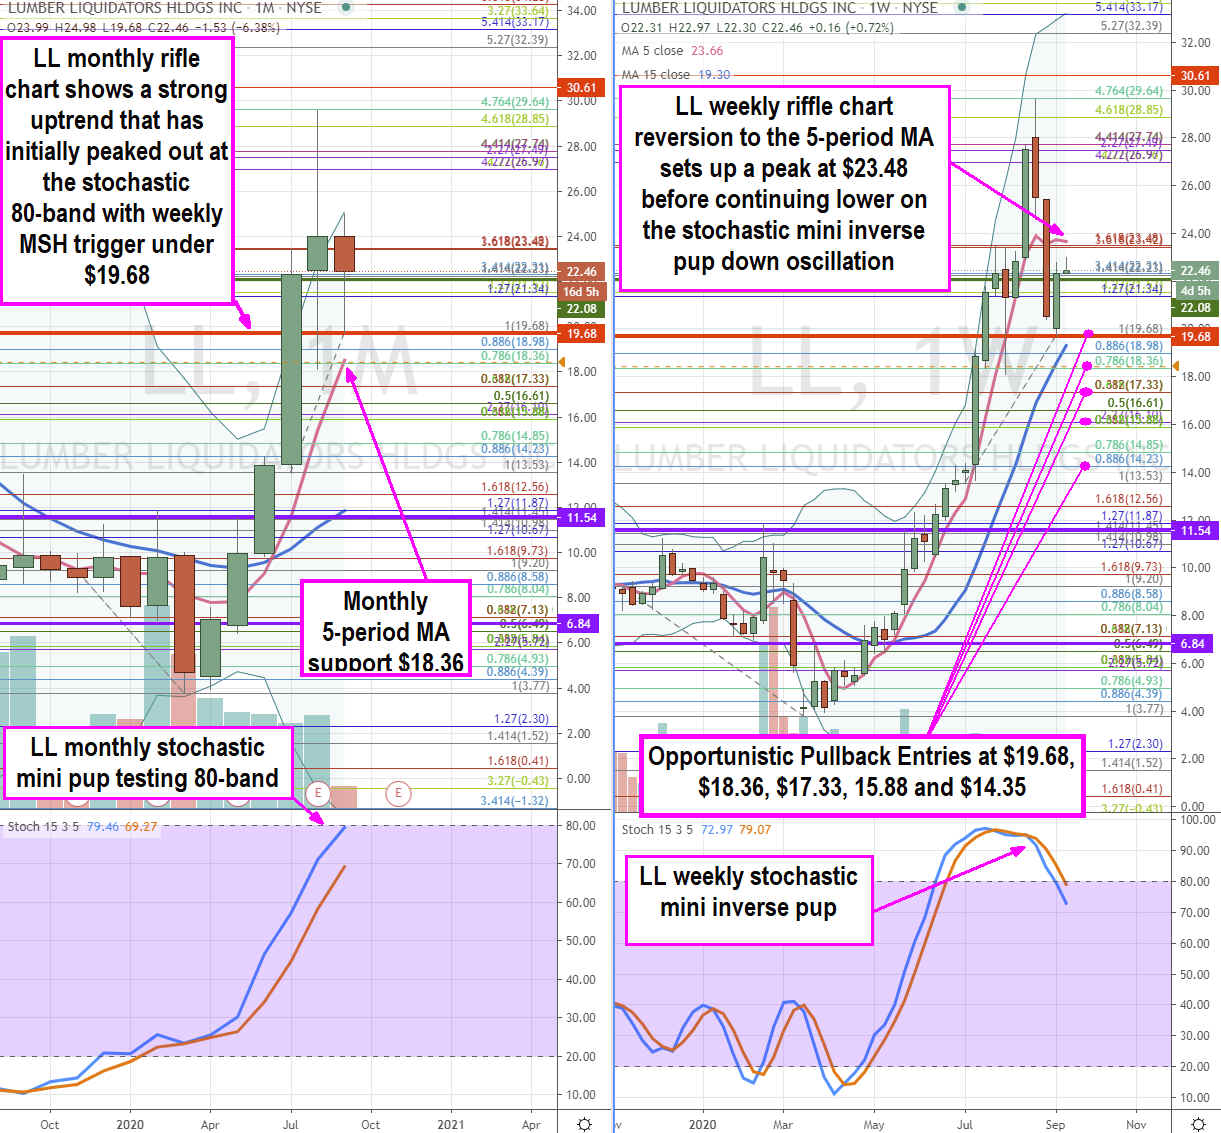
Shares of specialty hard surface retailer Lumber Liquidators Holdings Inc (NYSE:LL) have been on a rollercoaster ride surging off March lows of $3.77 through pre-COVID highs in June to peak out nearly 800% higher at $29.64.
The pandemic influenced stay-at-home mandates helped spur the home improvement wave as homeowners set out to remodel and renovate properties as a high demand low supply housing market took shape. The rally in Lumber Liquidators stock vastly outperformed the historic benchmark S&P 500 index rally. While the restart narrative accelerates, shares of Lumber Liquidators can present opportunistic pullback entries for nimble traders looking to scalp reversion bounces.
Q2 FY 2020 Earnings Release
On Aug. 5, 2020, Lumber Liquidators released its second-quarter fiscal 2020 results for the quarter ending June 2020. The Company reported earnings-per-share (EPS) profit of $0.10 excluding non-recurring items versus consensus analyst estimates for a loss of (-$0.12), a $0.22 per share beat.
Revenues dropped 20.2% year-over-year (YoY) to $230.28 million, surpassing consensus estimates for $220.63 million. Comparable same-store-sales (SSS) were down (-$21.3%) due to effects of COVID-19 but improved sequentially as lockdown restrictions were eased.
Conference Call Takeaways
The Q2 2020 conference call introduced the new name for Lumber Liquidators as LL Flooring and the new President and CEO Charles Tyson. During the pandemic, LL Flooring temporarily closed up to 56 stores while other stores operated under reduced hours and safety restrictions. This caused SSS comps to fall to (-45%) in the last week of March. By April, the migration to online sales resulted in a 260% YoY increase representing 20% of total sales. It scaled back its “largest event of the year” in April due to COVID-19 concerns. The week ending May 23rdsaw SSS comps rebound to (-30%).
Tariff Impacts
LL has benefited from the relief from Section 301 tariff list which originally impacted 46% of its products. The number of impacted products declined to 10% to 15% after November 2019 exclusion went into effect.
However, the Aug. 31 exclusion deadline was not extended on the products that impact LL Flooring the most. This means that 43% of product materials that LL imports from China will be subject to 25% tariffs from 10%. This could result in a $24 million to $35 million annual costs off the top-line, unless the Company mitigates the tariff effects by raising prices or find cheaper sources outside of China. Raising prices is a possibility due to the red-hot housing market.
Digital Innovations Driving Sales
LL Flooring has focused on galvanizing its online services to ensure touchless and contactless sales. The website upgrades include direct contact with warehouse-only stores to fulfill orders.
The Company adapted to online trend by developing in-store remote video consultation services for contactless engagements. They added more online tools with extensive floor samples.
It’s Picture It! online tool enables customers to visualize the products in their homes. Customers can then opt to come to the store to see the actual floor samples and finalize the sale. This additional attention to customer engagement could help justify the price raises as demand for home improvement is very strong. Prudent investors and nimble traders can look for opportunistic pullback opportunities to trade the reversion bounces.

LL Opportunistic Pullback Price Levels
Using the rifle charts on the monthly and weekly time frames provides a broader view of the landscape for LL stock. The monthly rifle chart triggered market structure low (MSL) buy above $11.54 as it staged a full weekly oscillation towards the 100-band.
The monthly stochastic is facing resistance at the 80-band as LL shares viciously peaked off the $29.64 Fibonacci (fib) level. The monthly rifle chart also set the market structure high (MSH) sell trigger under $19.68. This sets up the current reversion towards the weekly 5-period moving average (MA) to potential peak out at the $23.48 fib before resuming the downdraft back to test the weekly 15-period MA and monthly 5-period MA.
Here’s where nimble traders step into opportunistic pullback levels at the $19.68 monthly MSH trigger (quick stop-losses if 19 breaks since this is a sell trigger), $18.36 monthly 5-period MA support and fib, $17.33 fib, $15.88 fib and $14.35 fib and stinky 5’s zone.
Trades should be limited to scalps or near-term swings during the weekly stochastic oscillation down especially if the daily stochastic is also falling. The tariffs will continue to be a headwind leading up to the Dec. 31, 2020 expiration of the extension. The outcome of the Presidential election may also be extended due to potential delays with mail-in voting, so it’s best to keep to scalps.
