
Lululemon Athletica Inc. (NASDAQ:LULU) is set to release first-quarter fiscal 2017 results on Jun 1. The question lingering in investors’ minds is if this yoga-inspired athletic apparel company will be able to deliver a positive earnings surprise in the to-be reported quarter. In the trailing four quarters, the company outperformed the Zacks Consensus Estimate by an average of 2.1%, though it delivered a negative earnings surprise in the last reported quarter. Let’s see how things are shaping up prior to this announcement.
lululemon athletica inc. Price and EPS Surprise
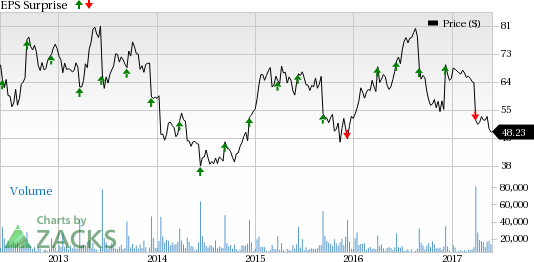
lululemon athletica inc. Price and EPS Surprise | lululemon athletica inc. Quote
What to Expect?
The current Zacks Consensus Estimate for the quarter under review is 28 cents, reflecting a year-over year decline of 5.1%. We note that the Zacks Consensus Estimate has been stable in the last 30 days. On the positive side, analysts polled by Zacks expect revenues of $512.7 million, up about 3.5% from the year-ago quarter.
Lululemon forms part of the Consumer Discretionary sector. Per the latest Earnings Trends, as of May 24, the Consumer Discretionary sector’s earnings are expected to advance 13.9%, with 12.5% revenues growth.
Factors at Play
While the prospects for the Consumer Discretionary sector appear favorable for the first quarter, we are not sure if Lululemon will be able to follow the industry trends. Incidentally, the company has underperformed the Zacks categorized Consumer Discretionary sector over the last three months, with its shares having plunged 26.2% against the sector’s growth of 3.3%. This bearish run is mainly accountable to management’s soft first-quarter outlook, which was provided with Lululemon’s last quarterly earnings report. The drab view was based on sluggish traffic in stores and lower conversions on Lululemon’s e-Commerce site, as it entered the first quarter.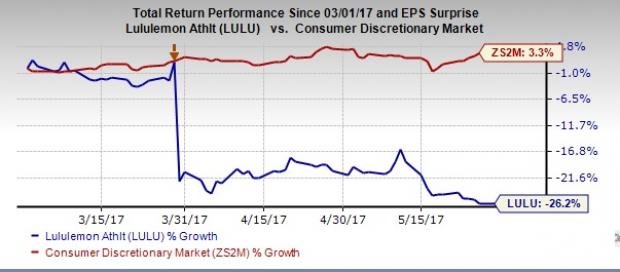
Based on those trends, Lululemon projected revenues in the range of $510–$515 million, with constant dollar comps expected to decline in the low single-digits range. A likely improvement in product margin is expected to boost gross margin. However, deleverage in product and supply chain costs, and occupancy and depreciation expense due to bleak sales in the fiscal first quarter may hurt results.
Further, the company predicts SG&A expenses deleverage of about 100–150 bps in first-quarter fiscal 2017, based on the sluggish comps trends. All said, Lululemon predicted earnings in the range of 25–27 cents per share, lower than the prior-year figure of 30 cents.
Nonetheless, the company remains focused on improving its e-Commerce and store trends, through strategies like solidifying product assortment, enhancing website and accelerating its omni-channel model. Additionally, the company is committed toward achieving its goal of doubling revenues and more than doubling earnings by 2020. These factors encouraged management to issue a decent view for fiscal 2017. Given the mixed signals, let’s wait and see if Lululemon can counter the aforementioned obstacles with its growth initiatives.
What the Zacks Model Unveils?
Our proven model does not conclusively show that Lululemon is likely to beat earnings estimates this quarter. This is because a stock needs to have both a positive Earnings ESP and a Zacks Rank #1 (Strong Buy), 2 (Buy) or 3 (Hold) for this to happen. You can uncover the best stocks to buy or sell before they’re reported with our Earnings ESP Filter.
Lululemon currently carries a Zacks Rank #3 (Hold), which increases the predictive power of ESP. However, the company has an Earnings ESP of 0.00% as both the Most Accurate estimate and the Zacks Consensus Estimate are pegged at 28 cents. The combination of Lululemon’ Zacks Rank #3 and ESP of 0.00% makes surprise prediction difficult.
Stocks Poised to Beat Earnings Estimates
Here are some companies you may want to consider as our model shows that these have the right combination of elements to post an earnings beat.
Fred's, Inc. (NASDAQ:FRED) has an Earnings ESP of +16.67% and a Zacks Rank #3.
You can see the complete list of today’s Zacks #1 Rank stocks here.
Lithia Motors, Inc. (NYSE:LAD) has an Earnings ESP of +0.91% and a Zacks Rank #3.
Fastenal Company (NASDAQ:FAST) has an Earnings ESP of +4.08% and a Zacks Rank #3.
More Stock News: 8 Companies Verge on Apple-Like Run
Did you miss Apple (NASDAQ:AAPL)'s 9X stock explosion after they launched their iPhone in 2007? Now 2017 looks to be a pivotal year to get in on another emerging technology expected to rock the market. Demand could soar from almost nothing to $42 billion by 2025. Reports suggest it could save 10 million lives per decade which could in turn save $200 billion in U.S. healthcare costs.
A bonus Zacks Special Report names this breakthrough and the 8 best stocks to exploit it. Like Apple in 2007, these companies are already strong and coiling for potential mega-gains. Click to see them right now >>
Lithia Motors, Inc. (LAD): Free Stock Analysis Report
Fastenal Company (FAST): Free Stock Analysis Report
lululemon athletica inc. (LULU): Free Stock Analysis Report
Fred's, Inc. (FRED): Free Stock Analysis Report
Original post