We have the distinction of living in an Age of Bubbles and their failures.
In 1980 it was commodities, wages, the CPI and the precious metals. Then the action shifted to inflation in financial assets which included the blow out in Tokyo on 1989 and the Tech Bubble in March 2000.
That crash set up the 2007 Bubble, which with outstanding action in residential real estate was a "Classic" bubble such as ended in 1929 or 1720.
The 2007 financial mania included the biggest bubble in the real price of base metals in a hundred years of data.
What hadn't been bubbled?
Lower-grade bonds.
As we have been outlining the bubble has been magnificent. Since the panic ended in 2009, junk has returned 150 percent which compares to the return of 90 percent from the S&P.
The default rate which had soared to 15 percent in 2009 has plunged to only 1.5 percent on the June report.
One would think that this is about as good as it can get. How long can it stay?
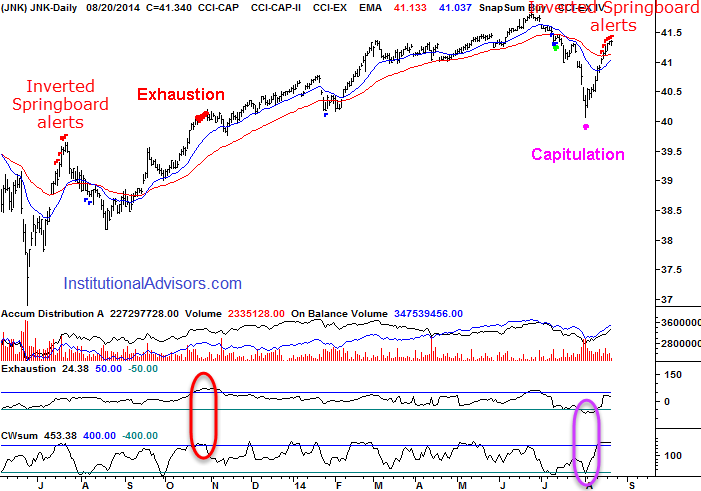
The surge in JNK into late June reached the most overbought (RSI 81) on a chart back to 2008.
The plunge into late July ended with a Springboard Buy and the Sequential Buy. The rebound was robust enough to set the opposite reading with a Inverted Springboard and is working on a Sequential Sell. The high was 41.81 and the low was 40.06. So far, the rebound has made it to 41.35. Technical patterns suggest it may not get much further. There is resistance at this level. Taking out the 40 level will mark a reversal that will rank with the forces that reversed all of the great bubbles listed above.