2016 opened with a horrendous market downturn. Investors witnessed the second correction in less than six months since August 2015. Debate over whether the US was going to enter a recession flooded the news media. Scarred by the traumatic start to 2016, investors moved quickly toward risk-averse strategies, choosing “flight” over “fight.” Low-volatility funds have benefited tremendously from this shift in investor sentiment, taking in more than $10bn so far this year.
More than just attracting new inflows, these funds are outperforming the S&P 500 by a significant amount this year. For example, the year-to-date (YTD) yield of one of the most popular low-volatility ETFs, iShares Edge MSCI Minimum Volatility (NYSE:USMV), is 7.79%, compared to the S&P 500’s return of 3.34%. Given the startling returns and low risk, should investors just park all their cash in these ETFs?
Not so fast.

I. Low Volatility ≠ No Risk
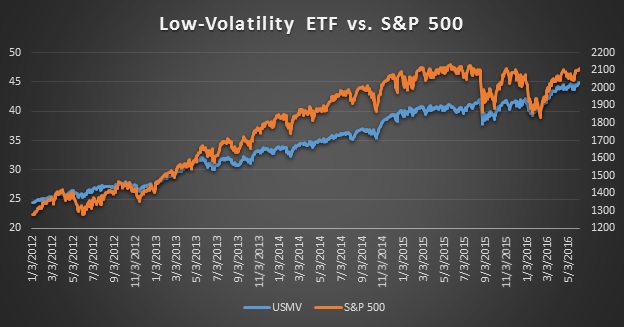
It is a common misconception that low-volatility ETFs carry no risk. Investors tend to act first and do their research later in a highly volatile environment, but they would be well-advised to find out what these low-volatility ETFs truly are before investing in them. The majority of these ETFs’ holdings are large-cap stocks with a concentration in the defensive sectors. This focus automatically lowers each ETF’s beta – a measure of a portfolio’s systematic risk and sensitivity to market movements. Reduced market exposure decreases price fluctuations of low-volatility ETFs, making them seemingly less volatile in a faltering market. However, reduced beta is in no way a guarantee that investors will not lose their capital should the market decline. As we can see in Figure 1, the co-movement between low-volatility ETFs and the S&P 500 has remained synchronized; the only difference is that the S&P 500 moves in a more violent manner. More importantly, no protection comes free in investing – while a lower beta moderates downside risk, investors also forgo upside potential. Hence, although low-volatility funds stand out during downward markets, they are not optimal candidates for long-term investment. Overall, unless investors adopt hedging methods, relying on low beta cannot completely shield their investments from downside risk.
II. Outperformance ≠ Best Performance
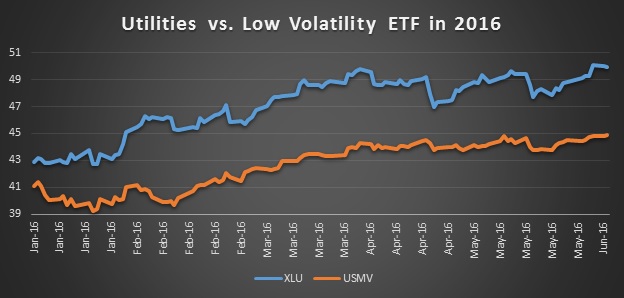
Markets have been going nowhere since 2015. The US 10-year Treasury is yielding only 1.71%, while Europe and Japan are in a negative interest rate policy (NIRP) environment. The 7.79% YTD return of USMV surely seems attractive. But are low-volatility ETFs the best deal available in a volatile market? As we analyzed previously, low-volatility ETFs are not as mysterious as they sound – they simply mimic traditional defensive strategy by adding relatively safe stocks from cyclical sectors. Nevertheless, does this really improve our old defensive strategy? To compare, we use the widely accepted defensive sector Utilities. The result may surprise many investors. As shown in Figure 2, the YTD price return of the Utilities sector ETF Utilities Select Sector SPDR (NYSE:XLU) is 16.33%, more than twice that of USMV. In addition, the risk-reward ratio using daily returns in 2016 is 15.74% for XLU and only 9.57% for USMV. The perennial defensive sector Utilities is apparently preferable in both absolute and risk-adjusted terms. Similarly, the YTD return of the Telecommunications sector ETF, iShares US Telecommunications (NYSE:IYZ), is 10.36%, and the Consumer Staples sector ETF, Consumer Staples Select Sector SPDR (NYSE:XLP), has yielded 6.59% YTD.

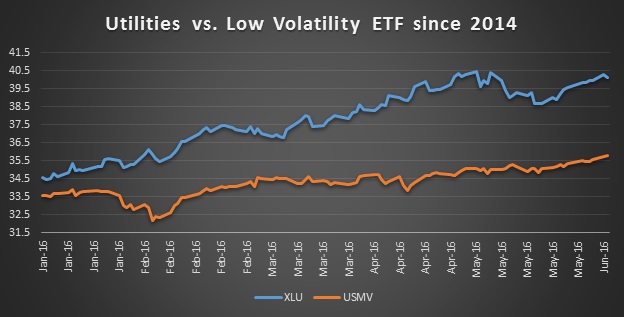
USMV has underperformed XLU not only this year but also over the long run. USMV’s performance was underwhelming until 2014, when it first started to outperform the S&P 500. But for the same period, XLU has done better than USMV by a substantial margin, as demonstrated in Figure 3. The price return for XLU since January 2014 is 44.59%, versus 33.53% for USMV.

III. Conclusion
Modern portfolio theory argues that each unit of risk should be fairly compensated by a certain amount of return. This constitutes the so-called risk premium. Risk-averse sentiment among investors often leads to the decision to forgo potential returns in order to trim portfolio risk. However, a savvy investor should consider maximizing returns while minimizing risk – these two tasks are not necessarily mutually exclusive. Newcomers such as USMV still have a long way to go before they dethrone the traditional defensive sectors such as Utilities.
Herd behavior is prevalent among investors, so we should make sure to do our homework before we follow others and jump into a new investment.
