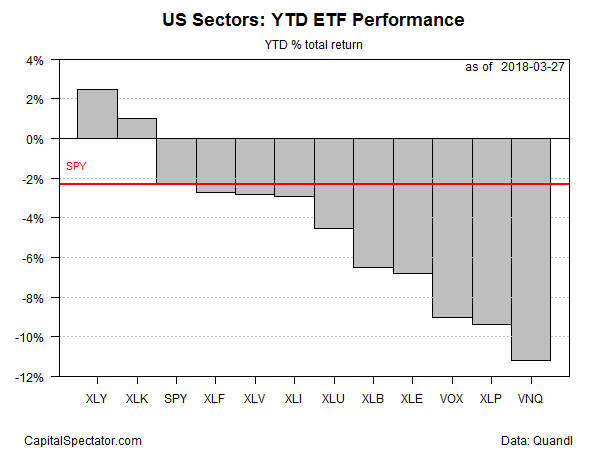
The revival of volatility in the US stock market this year has taken a toll on most equity sectors. Only two out of 11 sectors – consumer discretionary and technology – are posting year-to-date gains at the moment, based on a set of ETFs.
The top performer so far in 2018: Consumer Discretionary Select Sector SPDR (NYSE:XLY), which is ahead by a modest 2.8% through Mar. 27. Tech stocks are in second place via Technology Select Sector SPDR (NYSE:XLK), which is up 1.3% on a year-to-date basis. The remaining sectors, along with the broad market – SPDR S&P 500 (NYSE:SPY)) – are posting various degrees of loss, as of Tuesday’s close.

The year-to-date rise for tech masks the turbulence in recent days. Indeed, the sector has taken a dive lately, thanks to heightened uncertainty linked to the Facebook (NASDAQ:FB) data scandal. But as CNBC notes, “the tech sector sell-off is not just about Facebook’s data scandal anymore.”
Several of the market’s favorite technology stocks tanked as investors grew concerned over the companies’ ambitious growth following new developments Tuesday. The NYSE FANG index fell 5.6 percent on Tuesday and is down 6 percent over the last week, its worst showing since the index began in 2014.
Jamie Cox, managing partner at Harris Financial Group, advises that “the markets over the last week are trying to figure out the cost and the potential fines for Facebook specifically as well as the regulatory costs that come to the technology sector as a whole.”
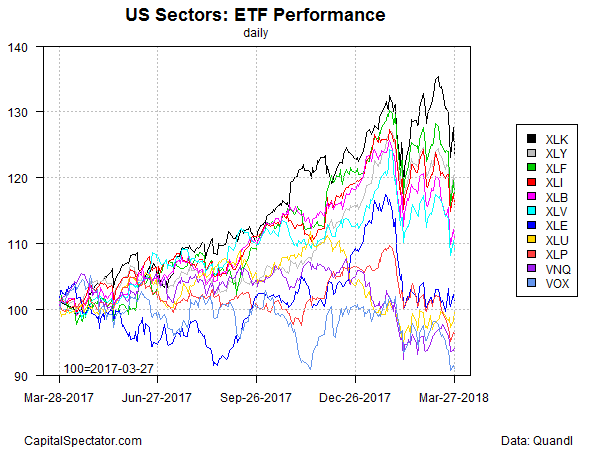
Over the trailing one-year period, the return profile looks more encouraging – just three sectors are in the red: consumer staples (XLP), real estate investment trusts (Vanguard REIT (NYSE:VNQ)), and telecom (Vanguard Telecommunication Services (NYSE:VOX)). In fact, tech continues to hold on to its lead for the year-over-year change. XLK is up a strong 24.0% for the trailing one-year period, comfortably ahead of the rest of the field. But as the performance chart below reminds, the recent turbulence is widespread, raising questions about how much upside is left in tech’s momentum.

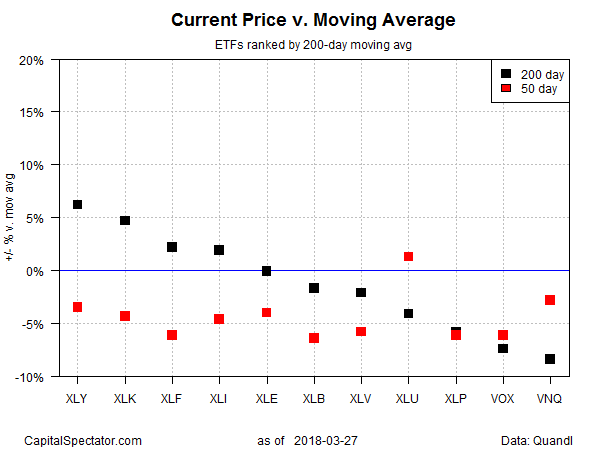
Ranking the sector ETFs by current price relative to 200-day moving average suggests that the headwinds are building generally. Most sectors are now trading below this trend benchmark, although tech is still one of the exceptions.

Nonetheless, the latest correction has dented the bullish case for tech. “The fact that the tech selloff accelerated in afternoon on heavy volume probably means a selloff will continue,” says Stephen Carl, head trader at Williams Capital Group. “One thing is feeding into another here: uncertainty over the [trade] tariffs, Zuckerberg’s testimony, weakness in Tesla (NASDAQ:TSLA). People don’t know which way things are going to go and are taking profits.”
