Overview
It was a quiet US session on Tuesday since the Americans celebrated Independence Day and the US markets were closed. During Monday’s European session June’s British Manufacturing PMI was released at 54.3 units, losing estimations of 56.5 while the German Manufacturing PMI was released 0.3 units higher than projections, at 59.6 units. The UK economic data kept on disappointing with the Construction PMI release on Tuesday at 54.8, losing the expectations of 55 units. The sharp upside rally of the Cable found resistance at around 1.3030 and the pair is testing the psychological support of 1.29 today. Euro’s rally against the Dollar corrects as well, EUR/USD found resistance at around 1.145 and the pair is testing the support of 1.133.
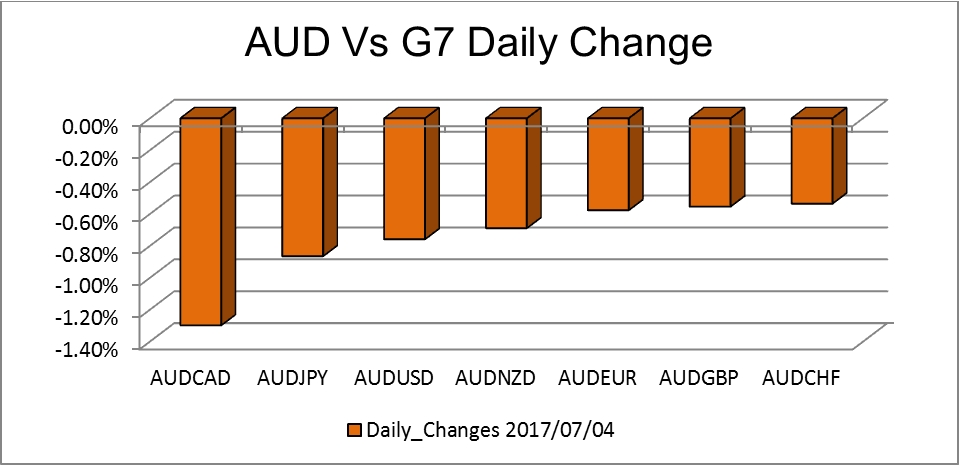
The Reserve Bank of Australia held its monetary policy meeting during Tuesday’s Asian session where it kept the interest rate unchanged at 1.5% and signaled that it is unlikely to raise the rates in the near future. The Australian Dollar sunk against the G7 after the announcement, with the AUD/USD falling 90 pips from 0.768 to 0.759. The pair did not manage to create a lower low and break the prevailing uptrend, so it is trying to recover today.
*The daily change is based on the open and close price recorded on Harborx Platform
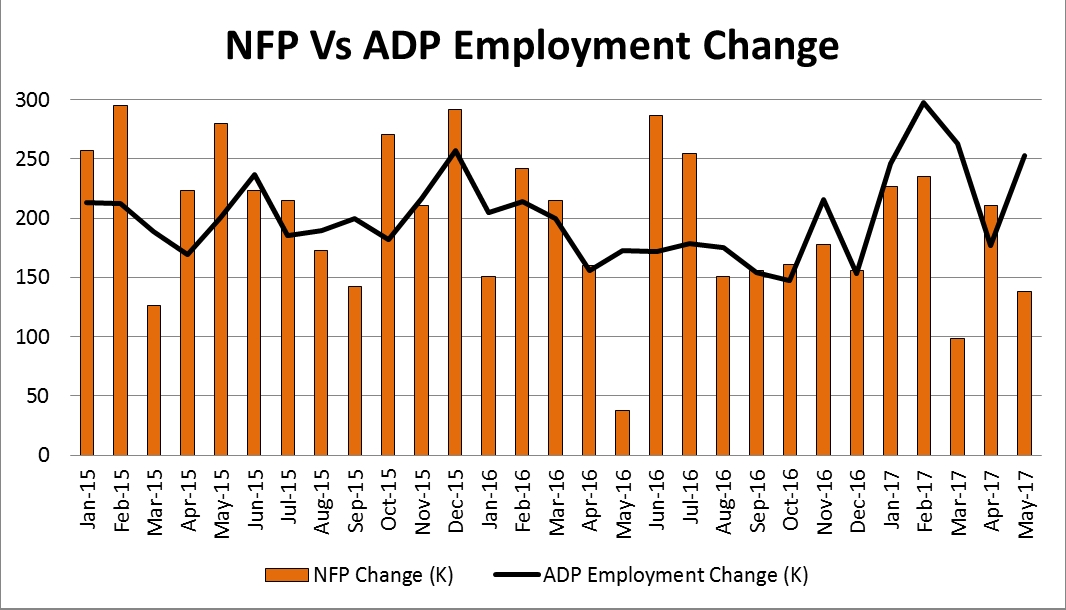
A new month has started and that means that the ADP Non-Farm employment change and NFP reports are due on Thursday and Friday accordingly. The Non-Farm Payroll report for May came out at just 138k jobs while April’s figure was readjusted at 174K, 37K lower than the actual release. The average NFP figure is lower than the previous year but the US unemployment rate keeps on falling, a signal that the US employment has reached its full levels. May’s unemployment rate was released at 4.3%, the lowest level since 2001 and the projection for June is again 4.3%. The ADP Non-Farm employment change will be released on Thursday at 12:15 GMT with projections being at 185K against the 253K of the previous month. The NFP is expected to be around 179K and Dollar’s depreciation will most likely continue if the actual figures are lower than expectations.
The highlight of the week, despite the NFP report, will be the FOMC meeting minutes that will be published today at 18:00 GMT. During June’s meeting, the Fed raised interest rates by 25 basis points and signaled for one more hike before the end of 2017. This information though is already priced in the markets and the Dollar failed to keep any gains after the announcement but instead it depreciated further. What investors are looking to hear from the Fed is the timing of the balance sheet normalization plans and more details on those. If the Fed fails to address any details today then the US Dollar is likely to fall further.
The Japanese Yen is losing its preference as investors trade riskier currencies lately. The Yen appreciated by 4.3% against the US Dollar for the last 15 trading days reaching a new session high today at 113.5. The pair corrected yesterday on the North Korean President’s Kim Jong-un comments that he would test an ICBM that could hit the US within this year. Investors bought the safe haven instruments including the Yen right after those comments but Yen’s depreciation lasted only for few hours. The Gopher is trading on an uptrend on the hourly and 4-hour chart while the next target to the upside is the daily high of 114.35; upon penetration of it the trend reversal on the daily basis will be confirmed as well.
Technical View
GBP/USD
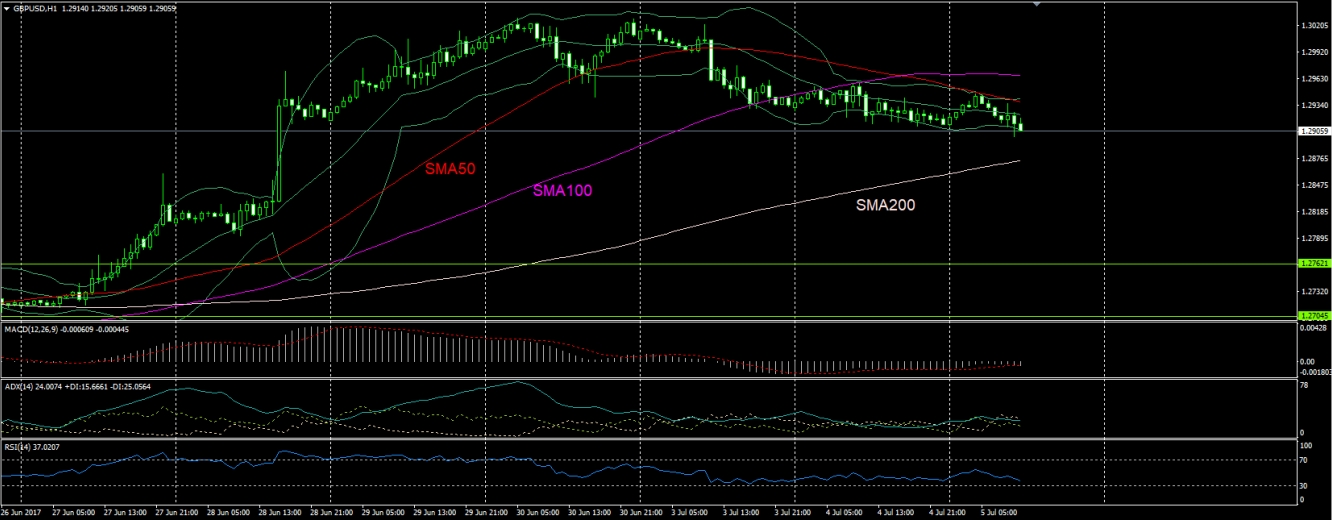
The Cable is recovering some of the sharp upside move it had the previous week. It already closed Monday and Tuesday lower while today it is trying to break the psychological support of 1.29. MACD is supportive of the corrective move since it is slopping downwards and it already crossed its equilibrium level while RSI is falling below its equilibrium and trying to break its oversold level. The next valid supports below 1.29 are near SMA200 at 1.2875 and 1.2825 thereafter. On the other hand, the resistances are near 1.2955, 1.30 and 1.3025.
USD/JPY
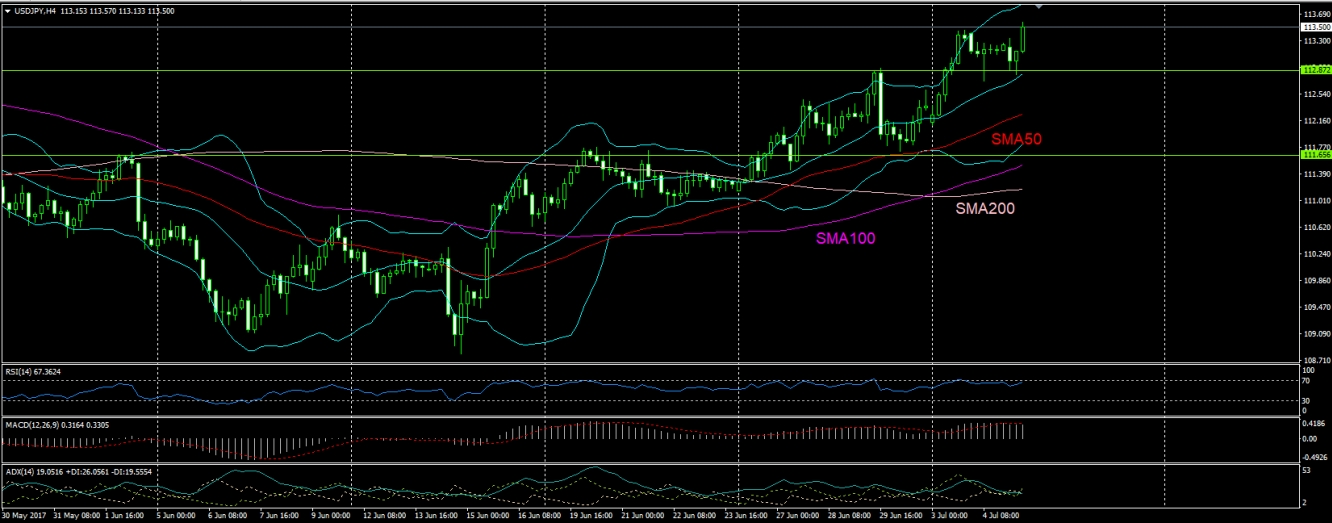
The Gopher is performing a very interesting pattern since on the hourly and H4 charts it is running on an uptrend while on the daily chart the downtrend is still valid. The pair is trading between Bollinger’s upper and middle band while the price is above the triple SMAs. Both RSI and MACD are trading on bullish territories while the Average Directional Index indicates no clear direction on the H4 chart. The valid supports on this timeframe are near 112.85 and 111.65 while the resistances can be found on the daily timeframe around 114.35 and 115.5.
Disclaimer: This material is provided as a general marketing communication for information purposes only and does not constitute an independent investment research. Nothing in this communication contains, or should be considered as containing, an investment advice or an investment recommendation or a solicitation for the purpose of buying or selling of any financial instrument. Users acknowledge that any investment in FX and CFDs products is characterized by a certain degree of uncertainty and that any investment of this nature involves a high level of risk for which the users are solely responsible and liable. We assume no liability for any loss arising from any investment made based on the information provided in this communication. This communication must not be reproduced or further distributed without our prior written permission.


