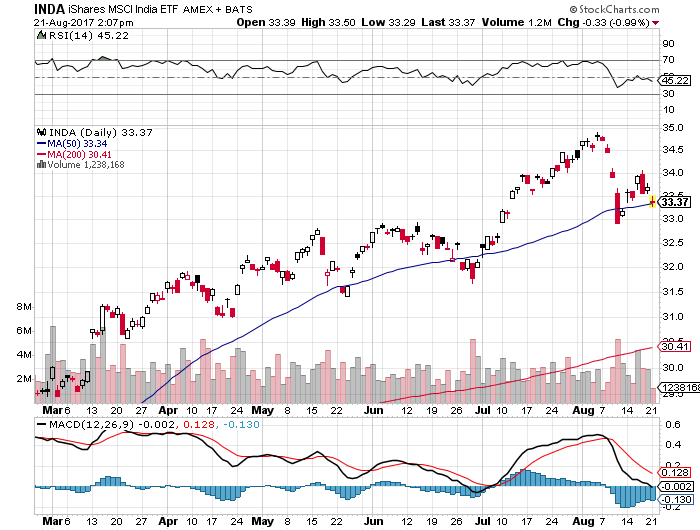
We have devoted some coverage lately to Asian markets amidst the recent slide in global equities, but one country that we have not touched upon recently is India.
Like other Emerging Markets, India has regressed sharply from trading at a new 52-week high just twelve trading sessions ago to its present levels, which is a fallback of more than 4% from its highs. The largest ETF tracker in the India Equity market is the $5.2 billion iShares MSCI India (NYSE:INDA) (Expense Ratio 0.71%), which has reeled in over $580 million year-to-date via creation flows, putting this fund at more than three times the size of the next largest offering in the space, WisdomTree India Earnings (NYSE:EPI) (Expense Ratio 0.84%, $1.7 billion in AUM).
There is only one other $1 billion-plus fund in this segment, and that is iShares India 50 (NASDAQ:INDY) (Expense Ratio 0.94%, $1.1 billion in AUM). After that, there is a fairly significant drop-off across other funds in this space in terms of AUM, with several “SmallCap” India portfolios that are outperforming their larger cap competitors in some cases by more than 700-800 basis points just year-to-date.
These funds include VanEck Vectors India Small-Cap (NYSE:SCIF) (Expense Ratio 0.78%, $310 million in AUM), iShares MSCI India Small-Cap (NYSE:SMIN) (Expense Ratio 0.80%, $202 million in AUM) and the $30 million Columbia India Small Cap (NYSE:SCIN) (Expense Ratio 0.86%). Given the recent decline and bearish bias in Emerging Markets including India, it would be nice to see a “Bear” or “Levered Bear” alternative in this segment, but there is not one currently as it was closed years back.
Direxion does however offer the $106 million “Levered Bull” product Direxion Daily MSCI India Bull 3X Shares (NYSE:INDL) (Expense Ratio 1.23%), which depending on a few factors, could potentially be shorted by aggressive short-term traders looking to capitalize on additional weakness in India.

The iShares MSCI India ETF (BATS:INDA) was trading at $33.38 per share on Monday afternoon, down $0.32 (-0.95%). Year-to-date, INDA has gained 24.98%, versus a 9.60% rise in the benchmark S&P 500 index during the same period.
INDA currently has an ETF Daily News SMART Grade of A (Strong Buy), and is ranked #3 of 75 ETFs in the Asia Pacific Equities Ex-China ETFs category.
