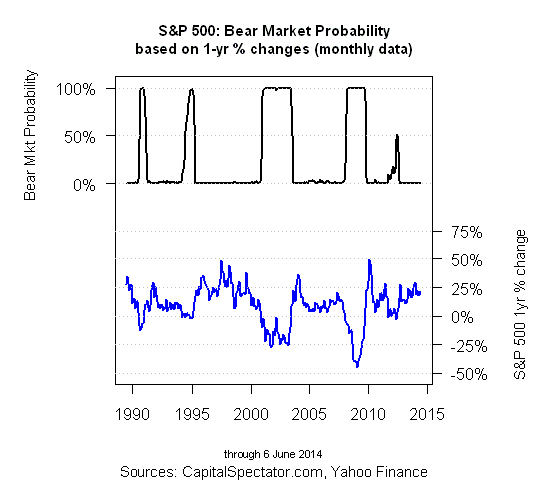
Would you know a bear market if you saw one? Hindsight suggests this is an easy task. The telltale signs are obvious… after the fact. From prices dropping below moving averages to negative rolling returns to an assortment of other technical signals, there’s a long list of empirical facts that equate with bear markets. The problem is recognizing, as early as possible, with a high level of confidence, that the market’s transitioned from a bull market to its dark counterpart and vice versa.
This crucial task only looks easy from the vantage of a rear-view mirror. Real-time analysis, by contrast, is plagued with all sorts of land mines and complications. As a result, what looks like a new bear market may turn out to be a brief run of turbulence. Another head fake is when you think a soft patch in the market is a buying opportunity only to find out that it was the start of an extended downturn.
One reason why identifying the start of bear and bull markets in real time can be difficult is the subjectivity that tends to harass the analytics. What looks ominous to you may appear non-threatening to another investor. How can we develop high-confidence, objective analysis on such a crucial issue for risk management? One solution is modeling market activity with a statistical technique known as a Hidden Markov model (HMM).
The idea here is looking for major changes in trend by analyzing prices, which are observable. The “hidden” aspect is the market’s current state. Bear and bull markets aren’t directly observable and so these regimes can only be inferred via price trends in a probabilistic framework. HMM is designed to do just that.
As a quick illustration of the concept, imagine that you’re trying to decide if it’s winter or summer. The only observable fact: how people on the street dress. Obviously, when you see you people wearing heavy coats, or not, you can infer if it’s winter or summer. Inferring the current state of the market is more complicated, but the same technique applies.
As a basic example, let’s use the depmixS4 package in R to model S&P 500 returns in search of evidence for deciding if we’re in one of two possible states, which we’ll call bull and bear markets for convenience. The results show that each state exhibits a high degree of persistence, as reflected by the associated transition probabilities. The probability of staying in a bear market state is around 94%; the persistence of a bull market state is a bit higher at nearly 97%. (The analysis uses rolling 1-year returns from 1951 through June 6, 2014, based on monthly data with month-end prices.) The critical goal is identifying those points in time when one state gives way to another. Casual observation suggests (and the transition probabilities confirm) that such regime changes are rare. Momentum, in other words, tends to prevail. But not always.
For example, analyzing the data through the HMM filter shows several distinct but relatively infrequent turning points since 1990. As you would expect, the regime shifts generally line up with high/positive and low/negative returns. The value of looking at the market through a HMM lens is that sometimes the signals that show the onset of bear and bull markets arrive slightly early, before its common wisdom, and before there’s a switch from positive (negative) returns to negative (positive).
In late-2007, for instance, HMM analysis told us in November of that year that a bear market had started. (Using 1-year returns with daily prices shows that the warning sign would have come on November 8.) It’s all obvious now, but at the time the market’s correction was slight and so there was still widespread optimism that the bull market would roar on.
As part of the analysis, HMM also generates the associated probabilities that a given state will prevail (or not). Note that the bear-market probability jumped to around 50% in mid-2012, but the higher risk was never confirmed with an outright signal change in the regime state (see chart above). This is a good example of how an HMM-based analysis can help us distinguish between what may look and feel like the start of a new bear market vs. the genuine article.
HMM’s encouraging track record as a tool for identifying major turning points in the market suggests that such signals may otherwise go undetected for some period of time. Accordingly, HMM deserves serious consideration as a foundation for dynamically managing asset allocation. In fact, that’s the lesson in a 2012 study on just that topic by Mark Kritzman, et al. in the Financial Analysts Journal (“Regime Shifts: Implications for Dynamic Strategies”). The paper concluded that an HMM-based strategy to forecast regime shifts “outperformed static asset allocation in backtests, especially for investors who seek to avoid large losses.”
Indeed, using HMM to analyze a range of asset classes and economic indicators provides a deeper level of clarity about trends. Is HMM flawless? No, of course not. No analytical process rises to that level. But this model’s track record holds out the potential to enhance your real-time asset allocation decisions.
The bottom line: HMM is a powerful tool for developing strategic intelligence for a rather simple reason: another regime shift (bear market) is always lurking in the future. The great mystery is one of timing. HMM can’t completely remove the shroud of uncertainty, but it can at least play a role in providing an early warning sign when the risk of a major trend change is unusually high.


