It often pays in life to take a longer view. To gather perspective and avoid knee-jerk reactions. This is generally the case for the stock market as well. Especially in the last few months where a 1% change has been described as a major event. This anchoring gets short term investors tied to the current view and when a two week range of 25 basis points in the S&P 500 is followed by a 50bp day suddenly the whole world has changed.
There are many ways to take a longer view in markets. You can just not even follow them, putting money in index funds until you retire. That may be a little to far to the extreme. Oddly that is what many of the Finance professors I work with do, but that is another story. Using technical analysis there are many tools to help see long term trends and wipe out short term stagnation or volatility. One of them is Renko charts.

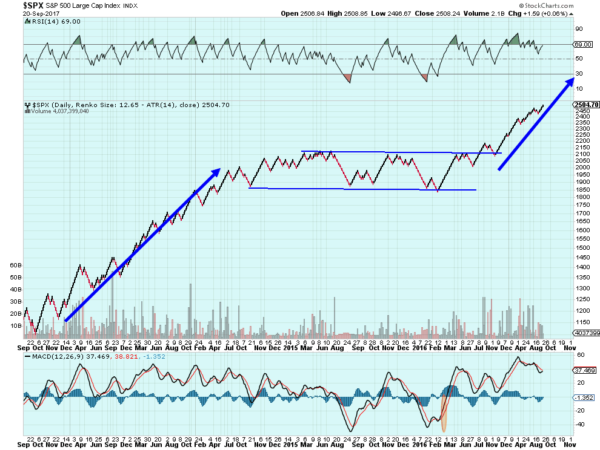
The chart of the S&P 500 above uses the renga (bricks) of the Renko to help give a longer view. In these charts a brick is added when the price exceeds the last one by the Average True Range (ATR), a volatility measure. Using this method it is easy to see the run higher in the Index out of the 2011 correction and consolidation into the 2015. That lasted until mid 2016 when the Index started higher again. It retested the break out level and then took off to the upside.
Now at 2500 with the world getting antsy about an impending crash, the Renko says to stay long the S&P 500. In fact a broad read would say there is a target to 2850 to complete a Measured Move higher. It may never get there, but the point is that there is a very different and calming picture when you pullback from the TV pundits and the short term tight range. Consider there may still be a long way to go in this current market upswing.
