Have you ever wondered when is the best time to buy dividend stocks?
In this article, I will analyze 3 dividend stocks over many decades to determine historically when the best time to buy is.
Returns on a few of the longest-lived, most well known stocks are calculated based on their dividend yield at different times.
This article examines if higher dividend yields really are associated with higher returns, as one would expect.
Coca-Cola Company (NYSE:KO)
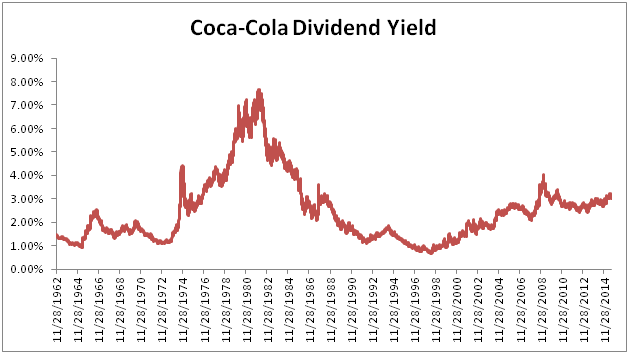
The image below shows Coca-Cola’s (KO) dividend yield since the end of 1962. A quick glance at the chart shows that Coca-Cola offered investors enormous yields of over 7% around 1980.

Aside from the high yield 1980 opportunity, Coca-Cola has largely been a low-yield stock. Over the last several years, the company’s yield has slowly crept higher.
Any time since the Great Recession of 2009 to now has given investors an opportunity to purchase Coca-Cola for a dividend yield of around 3%.
The table below shows the annualized compound total returns of Coca-Cola stocks at different dividend yields.
| Dividend Yield | Average Total Return | S&P 500 Total Return |
| -0.22% | 1.99% | |
| 1% – 2% | 7.05% | 5.94% |
| 2% – 3% | 10.44% | 6.97% |
| >3% | 32.69% | 14.73% |
The table above shows a clear relationship between Coca-Cola’s dividend yield and its total returns. In the table above, total return is calculated over a 10 year period. Data is used from 1987 onward. 1987 was used because that is the first year Coca-Cola qualified to be a Dividend Aristocrat (having 25 years of consecutive dividend increases).
Coca-Cola stock has outperformed the market much of the time when its dividend yield is above 1%. The stock has negative total returns over a decade when the dividend yield was below 1%.
You will see in the table above that Coca-Cola had insane 32.69% annualized total returns when its yield was above 3%.
Coca-Cola’s yield is currently above 3% but it will almost certainly not hit returns anywhere near this number. The company should have total returns of around 10% to 12% going forward based on its expected growth rate and dividend yield.
Looking at Coca-Cola’s historical yield and total returns paints an interesting picture. Coca-Cola stock has been a market-beating investment when purchased at dividend yields above 1%. At yields below 1%, the stock has actually destroyed shareholder value and underperformed the S&P 500 by over 2 percentage points a year.
Johnson & Johnson (NYSE:JNJ)
Johnson & Johnson (JNJ) is perhaps the most consistent dividend stock on the market. The company has 53 consecutive years of dividend increases and 31 consecutive years of adjusted earnings-per-share increases. I know of no other business that has such an impressive streak of earnings-per-share growth.
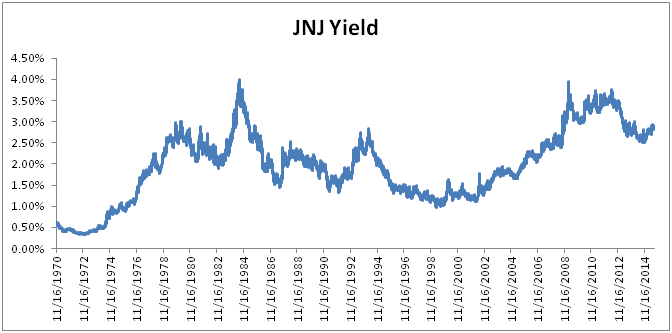
Johnson & Johnson has offered investors a dividend yield of between 4.0% and 1.0% for much of the last 40 years. The image below shows Johnson & Johnson’s dividend yield since 1970 to give a very long-term view of the company’s yield history.

Johnson & Johnson qualified to be a Dividend Aristocrat in 1987. Click here to see a list of all Dividend Aristocrats from 1989 through 2014.
The table below gives 10 year compound total returns for Johnson & Johnson stock purchased at different dividend yield levels since 1987. Results are compared to the S&P 500 to put returns into perspective.
| Dividend Yield | Average Total Return | S&P 500 Total Return |
| 2.75% | -4.06% | |
| 1% – 2% | 13.60% | 7.07% |
| 2% – 3% | 20.81% | 11.98% |
| >3% | N/A | N/A |
The higher Johnson & Johnson’s yield was, the greater its returns over the next decade – the exact same pattern seen with Coca-Cola. Johnson & Johnson also outperformed the market (on average) no matter its yield.
You will notice that 3% and higher yield data is not available. Since 1987, Johnson & Johnson only hit 3%+ yields during the time of the Great Recession (and afterwords). As a result, 10 year data is not yet available when the stock is yielding above 3%.
The same disclaimer used with Coca-Cola applies to Johnson & Johnson. Investors should absolutely not expect 20%+ total returns from Johnson & Johnson over the next decade. I believe the stock will generate total returns of around 9% a year – potentially slightly higher if its price-to-earnings ratio rises.
Exxon Mobil Corporation (NYSE:XOM)
ExxonMobil (XOM) is the largest and most dominant publicly traded oil corporation in the world. The company has a market cap of over $325 billion and has paid increasing dividends for 33 consecutive years.
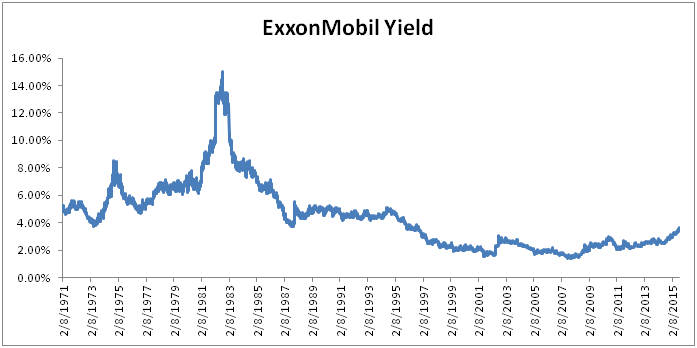
ExxonMobil stock had a dividend yield of 15%… Yes, 15% in 1982. The lowest dividend yield the stock has offered investors is a paltry (for ExxonMobil standards) 1.4% in 2007. Record oil prices caused ExxonMobil’s stock price to increase (and yield to decrease) in 2007.

Since 2007, ExxonMobil’s dividend yield has been on the rise. The company currently has a dividend yield of 3.7% – more than double lows set in 2007.
ExxonMobil has a very long corporate history. The company can trace its origins back to John Rockefeller’s Standard Oil. ExxonMobil did not qualify to be a Dividend Aristocrat as early as Johnson & Johnson or Coca-Cola, but investors have long thought of ExxonMobil as the gold (black gold?) standard of the oil industry.
The table below breaks ExxonMobil’s 10 year total returns since 1987 down by dividend yield.
| Dividend Yield | Average Total Return | S&P 500 Total Return |
| 9.51% | 2.29% | |
| 2% – 3% | 10.30% | 2.18% |
| 3% – 4% | 13.39% | 7.31% |
| >4% | 15.37% | 11.70% |
ExxonMobil follows the exact same pattern as Johnson & Johnson and Coca-Cola. The higher the company’s dividend yield, the greater total returns are over the next decade. Interestingly, ExxonMobil beat the S&P 500 over all dividend yield ranges in the time period studied.
Conclusions
Investing in high quality businesses typically outperforms the market. One can see the evidence in the clear outperformance of the Dividend Aristocrats Index over the S&P 500.
That’s a good starting point for individual investors; look for high quality investments.
Secondly, the higher a stock’s dividend yield as compared to its own yield history, the higher expected total returns will be over the next decade.
This makes intuitive sense. I’d rather own Coca-Cola paying me a 3% yield than paying me a 1% yield. I don’t think I’m alone in this opinion. Other investors also want to buy stocks when they have higher yields. Increased buying causes the stock price to rise and pushes yields down. This gives investors who bought in at higher yields a ‘value premium’ – you get more capital gains as the stock price rises.
It is important to note that comparing historical yields can have pitfalls. If a stock significantly changes its payout policy, higher yields can be misleading. For example, if a stock always paid out 10% of its earnings, and then boosted its payout ratio to 90% instead – of course its dividend yield would increase. However, it may not be a better value because of this.
Comparing a stock to its own historical yield does have merit. The 3 examples in this article show that buying high quality businesses works best when the company’s yields are higher than their historical averages.
