Here is a brief review of period-over-period change in short interest in the February 1-15 period in nine S&P 500 sectors.
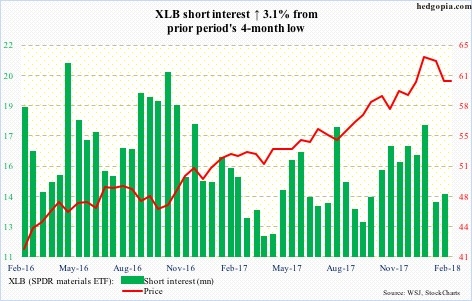
Materials Select Sector SPDR ETF (NYSE:XLB)
During the reporting period, XLB (60.71) went from 62.95 at January-end to an intraday low of 56.62 on the 9th to this Monday’s high of 61.60. Tuesday’s 1.4-percent drop pushed the ETF back below the 50-day moving average, which should begin to pose resistance near term.
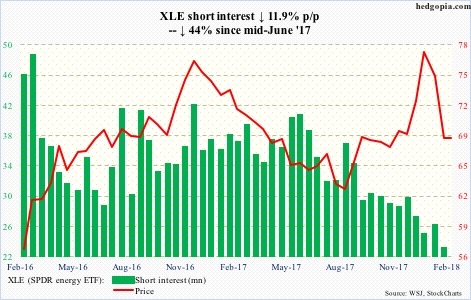
Energy Select Sector SPDR ETF (NYSE:XLE)
Post-February 9th reversal, XLE (68.31) traded around its 200-day for several sessions until last Friday when it broke out. The 20-day is still dropping, and stopped Tuesday’s rally attempts. If the 200-day (67.91) is breached, there is support at 66.60.
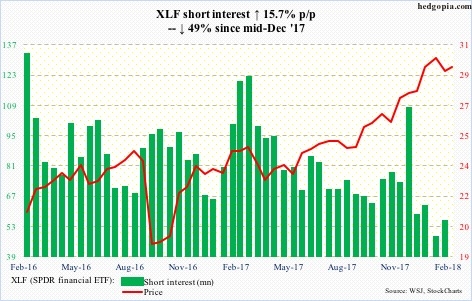
Financial Select Sector SPDR ETF (NYSE:XLF)
Tuesday, reacting to Jerome Powell’s, Fed chair, testimony to the Congress, interest rates rallied. XLF (29.28) nonetheless gave up early gains to end the session down one percent, with the high of 29.77 lower than 10-plus-year-high of 30.33 on January 29th.
Near term, support lies at the 50-day (28.75), which also approximates the 20-day.
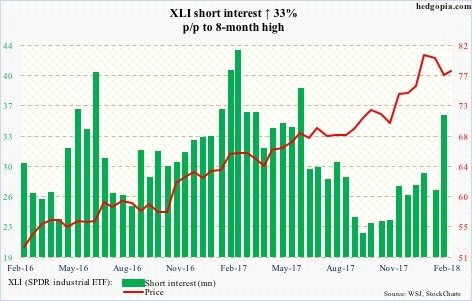
Industrial Select Sector SPDR ETF (NYSE:XLI)
Intraday between February 9th and Tuesday, XLI (77.76) rallied from 71.49 to 79.28, before reversing. Shorts did not quite buy into the rally. Short interest jumped 33 percent p/p to an eight-month high. A test of the 50-day (77.25) is just a matter of time. The daily chart is itching to go lower.
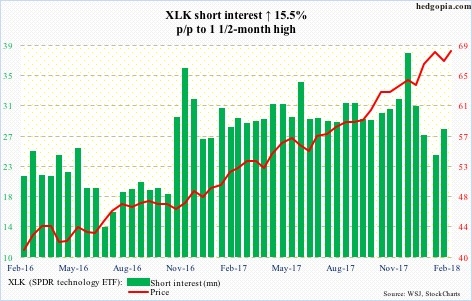
Technology Select Sector SPDR ETF (NYSE:XLK)
Post-February 9th reversal, XLK (68.66) is the only sector ETF that has gone on to rally to a new high. Tuesday’s intraday high of 69.71 surpassed the prior high of 69.19 on January 26th, but not before reversing.
The daily chart is extended. Moving-average support lies just north of 66.
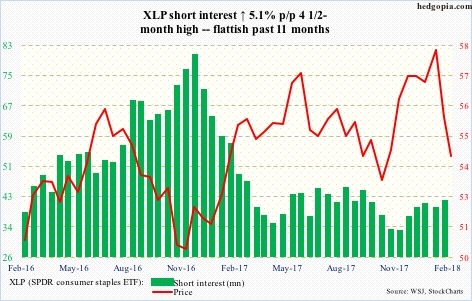
Consumer Staples Select Sector SPDR ETF (NYSE:XLP)
After XLP (53.97) lost the 200-day on February 5th, it remained north of the average (55.39) just once (16th). For now, it is caught between that average and support at 52-plus (intraday low of 52.66 on February 9th).
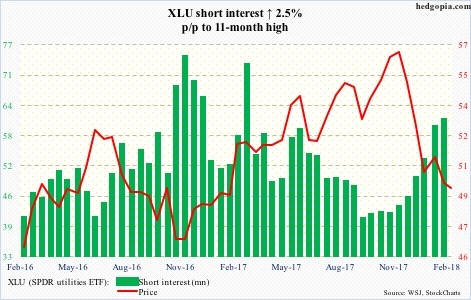
Utilities Select Sector SPDR ETF (NYSE:XLU)
XLU (49.40) short interest has gradually gone up the past few months. Since the low on February 6th, the ETF rallied, leaving open the possibility of a squeeze should the 50-day be taken out. That was not to be, as the average was just about tested Monday. The aforementioned backup in rates smacked the ETF Tuesday, and remains vulnerable near term.
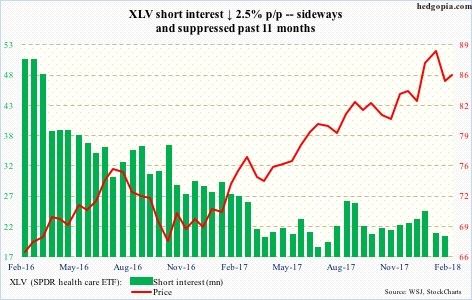
Health Care Select Sector SPDR ETF (NYSE:XLV)
XLV (85.51) is above the 50-day (85.40), but barely. After this, there is support at 84-plus. A loss of both makes the ETF vulnerable to a test – again – of the 200-day (81.57).
Consumer Discretionary Select Sector SPDR ETF (NYSE:XLY)
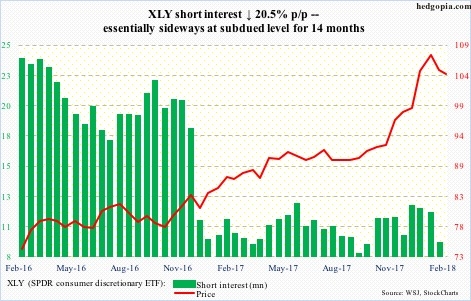
As did most other sector ETF’s, XLY (104.54) produced a nasty looking candle on Tuesday. The intraday high of 106.90 in that session remained well under the all-time high of 109.34 on January 29th. The 50-day (103.24) is a stone’s throw away, and likely gets tested.
Thanks for reading!

