EUR/USD
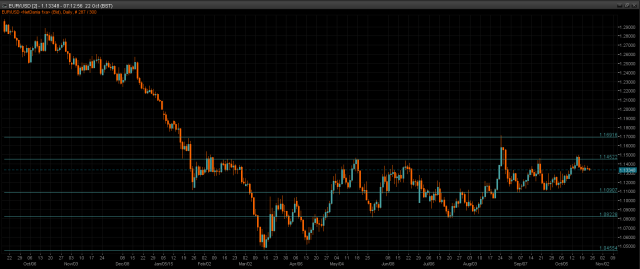
Outlook: Short Term (1-3 Days): Bullish – Medium Term (1-3 Weeks): Bearish
Fundamental: EUR traded within the range of 50 pips since Tuesday after the sudden decline in gold prices caused the greenback to rally. The pair was reluctant to move too far away with dollar being strong, as investors are waiting for the ECB policy meeting outcome later in the day
Technical: A close above 1.1390 is now required to present the catalyst for renewed topside momentum, bringing the key 1.1500 resistance level back into play. To the downside, we continue to look at the recent nonfarm break up levels, with 1.1310 and 1.1270 providing key support.
Interbank Flows: Bids 1.13 stops below. Offers 1.1390 Stops above.
Retail Sentiment: Bearish to neutral
Trading Take-away: Sidelines for now
GBP/USD
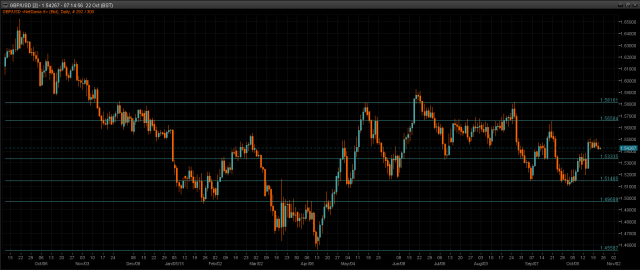
Outlook: Short Term (1-3 Days): Bullish – Medium Term (1-3 Weeks): Bearish
Fundamental: GBP hit the lowest level in a week to 1.5408, while it has been moving sideways between 1.5400 and 1.5500 since Oct 14. British traders will be focusing on the September retail sales report out today, which could move the cable. After that, ECB and Draghi’s press conference could have impact on cable as well if the euro moves significantly in the market
Technical: While 1.5380 supports downside reactions, expect a grind higher to test 1.56 symmetry objective. A breach of 1.5360 targets a retest of pivotal 1,53 support.
Interbank Flows: Bids 1.54 stops below. Offers 1.5550 stops above
Retail Sentiment: Bearish to neutral
Trading Take-away: Buy pullback against 1.5380 targeting 1.56
USD/JPY
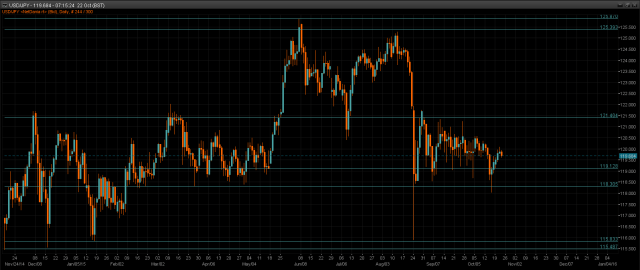
Outlook: Short Term (1-3 Days): Bullish – Medium Term (1-3 Weeks): Bearish
Fundamental: Japan’s September export growth (year over year) has been slowed down in three consecutive months as shrinking sales to China hurt the volume of shipments, raising fears that decreasing overseas demand may have pushed the economy into recession. Weak indicators will keep BoJ under pressure to ease policy again to hit its ambitious 2 percent inflation target next year.
Technical: Breach of 119.50 eases bearish pressure and opens a retest of 120.50 next. A failure at 119 support suggests upside failure and a rotation back to 118 support to follow.
Interbank Flows: Bids 118.50/30 stops below. Offers 120.50 stops above
Retail Sentiment: Bullish
Trading Take-away: Sidelines for now
EUR/JPY
Outlook: Short Term (1-3 Days): Bullish – Medium Term (1-3 Weeks): Bearish
Fundamental: The pair was pressured as the weak Japanese trade data fueled BoJ stimulus calls; on the other, supported on the back of weaker equities. Expect trading range for the pair to remain tight ahead of the ECB later. The August All Industry Activity index came in lower at -0.2% m/m, in line with expectations, but the July index was revised to a contraction of -0.1% (from +0.2%). Meanwhile, Japan supermarket sales grew at a faster clip of 2.9% y/y in September (from 2% in August) as compared to department store sales, which saw growth slowing in September. .
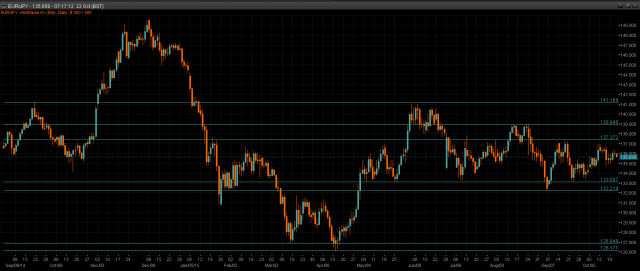
Technical: While 136.50 caps upside reactions, expect a retest of 134.80. A failure here sets bearish tone, targeting 133.40 next. A break back above 136.50 eases bearish pressure and sets a retest of 137.
Interbank Flows: Bids 134.80/60 stops below. Offers 137 stops above
Retail Sentiment: Bearish
Trading Take-away: Sidelines for now
AUD/USD
Outlook: Short Term (1-3 Days): Bullish – Medium Term (1-3 Weeks): Bearish
Fundamental: AUD was hit hard yesterday after the Shanghai Composite stock index closed more than 3% lower and copper prices dropped dramatically due to weakening demand from China. As markets moved away from the Australian dollar and into the relatively safety of the US dollar, AUD/USD remained under pressure at 0.7215 levels. Markets will pay attention to unemployment claims from the US due today
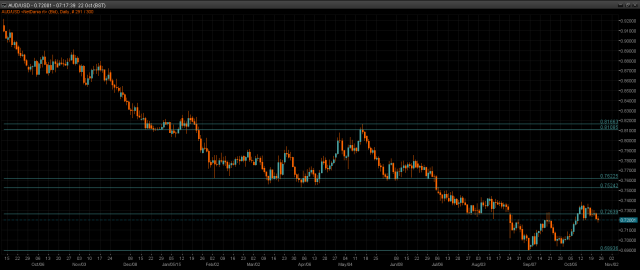
Technical: Bids ahead of .7200 being tested, while this level holds on an intraday basis expect a retest of offers above .7300. A close back above .7300 targets a .7400 resistance next. Failure at .7200 targets .7160 symmetry objective.
Interbank Flows: Bids .7200 stops below. Offers .7400 stops above
Retail Sentiment: Bearish
Trading Take-away: Sidelines for now
USD/CAD
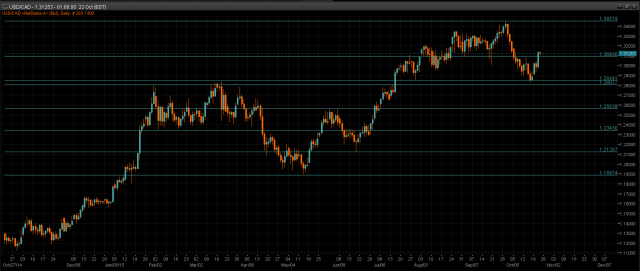
Outlook: Short Term (1-3 Days): Bearish – Medium Term (1-3 Weeks): Bullish
Fundamental: CAD weakened against US dollar after the Bank of Canada lowered its growth forecasts for 2016 and 2017. The bank held its key rate steady, but said that growth would be slower than previously forecast as lower prices for oil and other commodities were dampening business investment and exports in the resource sector.
Technical: Near term bearish trend remains intact as intraday resistance at 1.3260 contains intraday upside reactions bears target a retest of bids below 1.2850. A breach of 1.3260 opens test of 1.3450 offers and potential broader bullish trend continuation
Interbank Flows: Bids 1.2850 stops below. Offers 1.3060 stops above
Retail Sentiment: Neutral to bearish
Trading Take-away: Sidelines for now
