As markets are plunging globally, analysts who study charts are eyeing the key levels to monitor.
The theory behind technical analysis is when prices reach previous levels where participants bought and sold in volume, those levels can be areas of support.
“The market has memory. Historic levels of supply tend to be recognized by market participants in the future when these prices are tested once again,” said J.C. Parets, president of Eagle Bay Capital.
As the market falls, CNBC Pro asked expert technicians where the key support levels are:
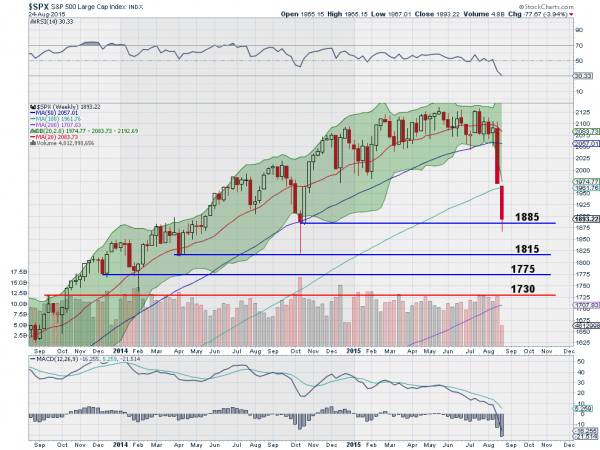
Above is a free teaser from CNBC Pro, the rest is behind their paywall. This is my chart and my comments:
“Markets are following through to the downside and the technicals look weak, supporting that view of selling off,” wrote Greg Harmon of Dragonfly Capital Management.
Harmon’s first level of support for the S&P 500 is 1,885, which is the settle point of the October 2014 low, and his next level is 1,815 from the low in April 2014.
Harmon is looking for a bounce as his key indicators are extremely oversold and the long-term trend is still intact.
“The momentum indicators (Relative Strength Index and Moving Average Convergence Divergence) have turned into the bearish zone. But the S&P 500 is well outside of the Bollinger Bands®, so an oversold bounce could happen at anytime,” Harmon said. “The long-term uptrend is not in jeopardy at this point, but certainly the intermediate and short-term trend have shifted to down.”
Disclaimer: The information in this blog post represents my own opinions and does not contain a recommendation for any particular security or investment. I or my affiliates may hold positions or other interests in securities mentioned in the Blog, please see my Disclaimer page for my full disclaimer.
- English (UK)
- English (India)
- English (Canada)
- English (Australia)
- English (South Africa)
- English (Philippines)
- English (Nigeria)
- Deutsch
- Español (España)
- Español (México)
- Français
- Italiano
- Nederlands
- Português (Portugal)
- Polski
- Português (Brasil)
- Русский
- Türkçe
- العربية
- Ελληνικά
- Svenska
- Suomi
- עברית
- 日本語
- 한국어
- 简体中文
- 繁體中文
- Bahasa Indonesia
- Bahasa Melayu
- ไทย
- Tiếng Việt
- हिंदी
Levels To Watch In The SPX
Published 08/25/2015, 01:55 AM
Updated 05/14/2017, 06:45 AM
Levels To Watch In The SPX
Latest comments
Loading next article…
Install Our App
Risk Disclosure: Trading in financial instruments and/or cryptocurrencies involves high risks including the risk of losing some, or all, of your investment amount, and may not be suitable for all investors. Prices of cryptocurrencies are extremely volatile and may be affected by external factors such as financial, regulatory or political events. Trading on margin increases the financial risks.
Before deciding to trade in financial instrument or cryptocurrencies you should be fully informed of the risks and costs associated with trading the financial markets, carefully consider your investment objectives, level of experience, and risk appetite, and seek professional advice where needed.
Fusion Media would like to remind you that the data contained in this website is not necessarily real-time nor accurate. The data and prices on the website are not necessarily provided by any market or exchange, but may be provided by market makers, and so prices may not be accurate and may differ from the actual price at any given market, meaning prices are indicative and not appropriate for trading purposes. Fusion Media and any provider of the data contained in this website will not accept liability for any loss or damage as a result of your trading, or your reliance on the information contained within this website.
It is prohibited to use, store, reproduce, display, modify, transmit or distribute the data contained in this website without the explicit prior written permission of Fusion Media and/or the data provider. All intellectual property rights are reserved by the providers and/or the exchange providing the data contained in this website.
Fusion Media may be compensated by the advertisers that appear on the website, based on your interaction with the advertisements or advertisers.
© 2007-2024 - Fusion Media Limited. All Rights Reserved.

