Last week’s review of the macro market indicators saw that heading into the end of the first Quarter equity markets showed some signs of cracking, with the IWM the worst. Elsewhere looked for gold to continue in its uptrend while Crude Oil (United States Oil (NYSE:USO)) continued lower. The U.S. dollar index also looked to continue lower while U.S. Treasuries (TLT (NASDAQ:TLT)) continued higher in their consolidation range.
The Shanghai Composite looked to continue a slow grind up and Emerging Markets ($EEM) continued to look strong. Volatility looked to remain low but drifting higher into more normal levels. This could hold back equities in the very short term. The equity index ETF’s SPY (NYSE:SPY), IWM (NYSE:IWM) and QQQ (NASDAQ:QQQ), all had their biggest pullbacks of the year, leaving the IWM at the edge of support, the SPY pulling back and the QQQ consolidating.
The week played out with gold pushing higher but it ran into resistance quickly and pulled back while crude oil found support and reversed higher. The U.S. dollar moved opposite of gold, starting lower and then quickly reversing while Treasuries found resistance at the top of their range and pulled back. The Shanghai Composite pulled back near support while Emerging Markets consolidated before Friday profit taking.
Volatility started higher Monday but quickly retreated. The Equity Index ETF’s all started the week with a gap down open but rose through the day and the rest of the week, with the QQQ making new all-time highs but the IWM and SPY still looking for a higher high. What does this mean for the coming week? Lets look at some charts.
SPY Daily
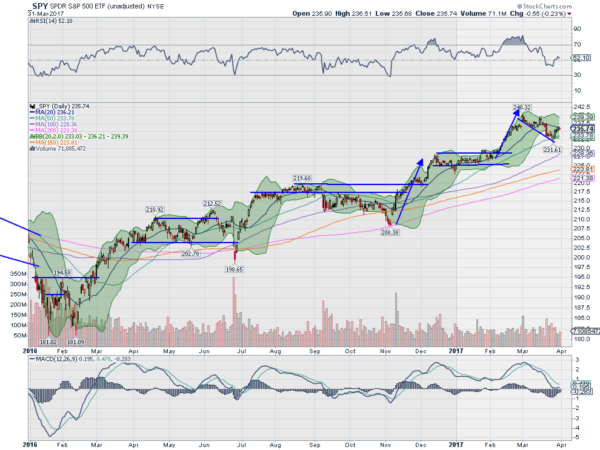
The SPY started Monday breaking a short consolidation to the downside. This move below the 50 day SMA for the first time since before the election, set up a continuation of the pullback that started from the March 1 high. But it also moved it out of its Bollinger Bands®, a place it does not like to be.
By the end of Monday it had retraced nearly all of the move lower and had moved back over its 50 day SMA. It then continued higher all week, making it back to the 20 day SMA. The daily chart shows it has yet to make a higher high though, so it has work left before declaring a reversal. The RSI held in the bullish zone and is rising back through the mid line, while the MACD is moving towards a cross up. The MACD held positive during the downturn.
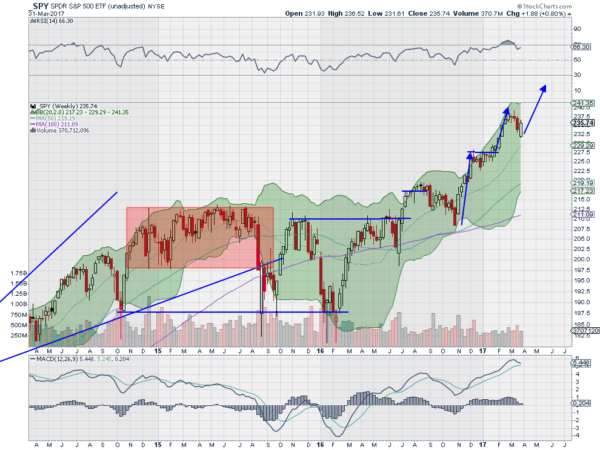
On the longer weekly chart 4 candles increasing in size as it pulled back, but this week’s positive candle is also a Marubozu, quite bullish. The RSI is moving back higher and the MACD is looking like it may avoid a cross down. There is resistance at 237.10 and 239.80 above. Support lower comes at 236 and 233.70 followed by 232.20 and 229.40. Consolidation in the Uptrend.
SPY Weekly
With the first Quarter in the books equity markets are trying to brush off the recent pullback and start higher. Elsewhere look for gold to consolidate in the short run while crude oil continues higher. The U.S. dollar index looks better to the upside for the coming week while US Treasuries remain in their consolidation range. The Shanghai Composite looks to continue to drift higher, trying to separate with long term levels and Emerging Markets continue to move higher.
Volatility looks to remain at abnormally low levels keeping the wind at the backs of the equity index ETF’s SPY, IWM and QQQ. Their charts look constructive on the short term, and bullish for the QQQ, while longer term in consolidation. Perhaps the short term will spill over into the longer term. Use this information as you prepare for the coming week and trad’em well.
The information in this blog post represents my own opinions and does not contain a recommendation for any particular security or investment. I or my affiliates may hold positions or other interests in securities mentioned in the blog, please see my disclaimer page for my full disclaimer.
