Some are saying last week's market movement is one for the record books. I have seen descriptions noting the market decline was unprecedented or the market is in turmoil. S&P Dow Jones Indices Indexology Blog titled a post, I'm Exhausted, but outlines data that places the market decline in perspective. One data point in S&P's post,
"Keeping perspective, as repeatedly noted, while 1000 point declines make for frightening headlines, the percentage changes represented by those moves are not uncommon. To wit, there have been nearly 300 daily 4% or greater moves since the DJIA’s inception. Put another way, 3 of the top 10 worst point drops on record occurred during this recent spell; none of them, however, come anywhere near the worst percentage."
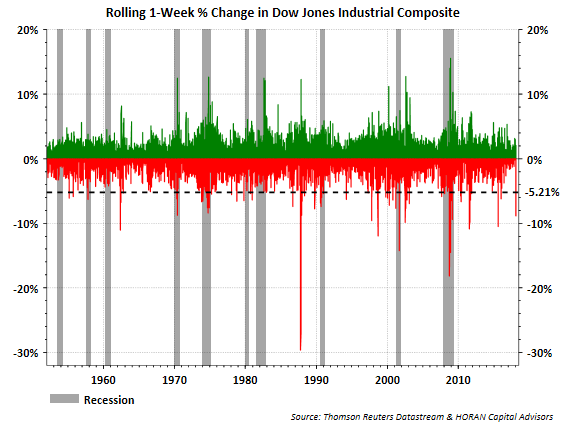
Below is a chart showing the rolling one week return for the Dow Jones Industrial Average. For the week, the Dow Jones Index ended down 5.21%, but noteworthy is the fact the index has experienced worse weekly drawdowns in the past as can be seen below. 
What has been unprecedented is the lack of market volatility for nearly two years. In Jeff Miller's weekly post on his Dash of Insight blog, Weighing the Week Ahead, he notes that "drawdowns of 5-10% are completely routine, often occurring several times a year. The last two years have been quite unusual."
In this regard, Ned Davis Research notes since January 1928 there have been:
- 303 pullbacks of more than 5%, with 3.4 mean number of occurrences per year and.
- 96 pullbacks of more than 10%, with 1,1 mean number pf occurrences per year.
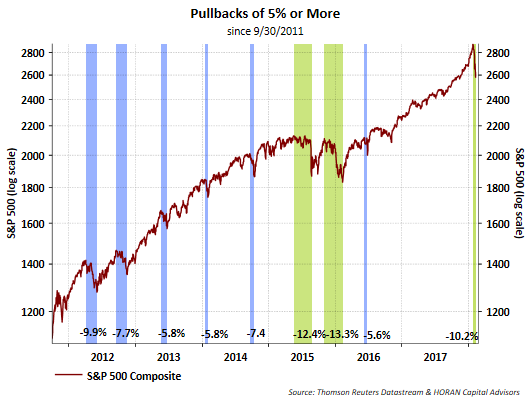
As the below chart of pullbacks shows, the last 5%+ pullback occurred in the summer of 2016 and the last double digit pullback occurred in early 2016, nearly two years ago. This lack of downside market movement and a near parabolic equity market advance late last year and through January of this year is what has been unprecedented. 
Absent on the above chart is a bear market decline that would equal 20% or more. Ned Davis notes there have been 25 bear market declines since January 1928, with the last one occurring in the financial crisis on January 6, 2009. Given the continued strength in the economy and the improved corporate earnings outlook, a bear market decline seems unlikely at the moment.
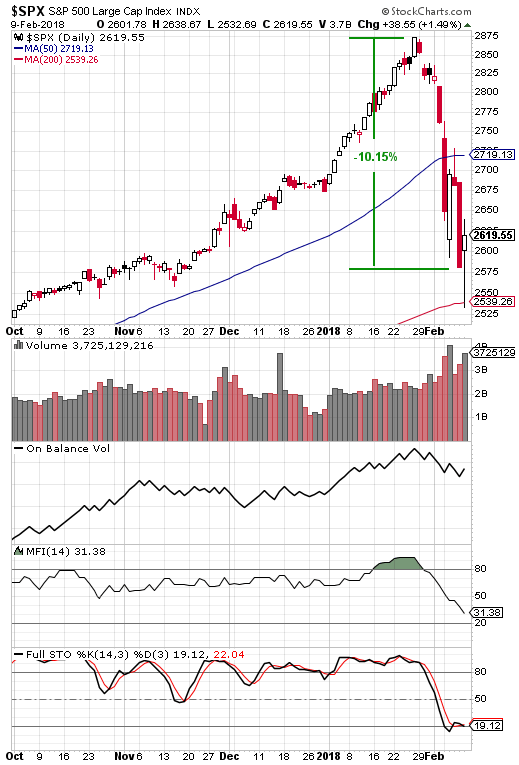
And finally, as Michael Batnick notes in a post this week and published on his Irrelevant Investor blog, the other unprecedented variable in the recent market move is the quickness in which the market declined. In nine short days, the equity market went from overbought to oversold. 
It would seem difficult to believe that all the potential market froth could be washed out in just nine days, but this market's advance over the last year and a half, and really since the end of the financial crisis, has been unprecedented in the face of a slowly growing economy. If the economy is picking up steam now, as data seems to suggest, a further market advance from this level is probable, but not likely to occur in a straight line higher.
