Global manufacturing data have been exceedingly grim. One would be hard-pressed to find a country in Europe, Asia or North America that is exporting products with little difficulty.
If the United States wishes to export products at a higher clip, we’d require partners with the means to afford our products. Yet the U.S. dollar’s strength alongside foreign tariffs is impeding the process.
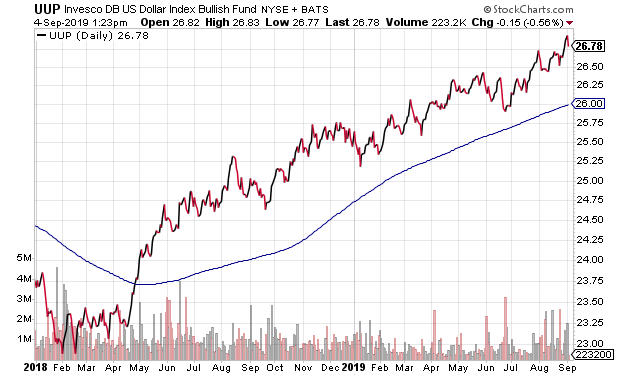
One might think that the dollar’s strength would be helpful in importing products from other countries. At the moment, however, a wide range of imported goods have been tagged with tariffs that wind up costing end-using consumers a whole lot more money.
For the most part, the U.S. consumer has been strong and resilient. On the other hand, if we’re not acquiring enough goods from places like the United Kingdom and Germany, it may adversely affect jobs stateside.
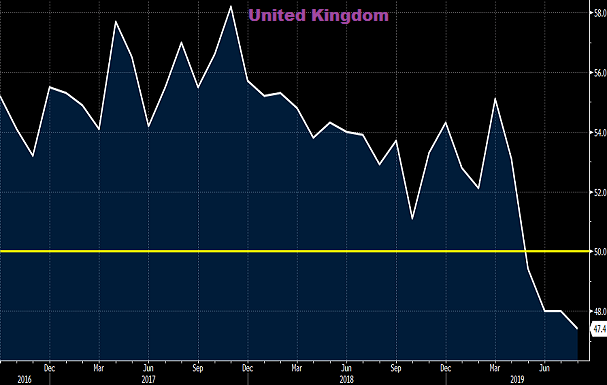
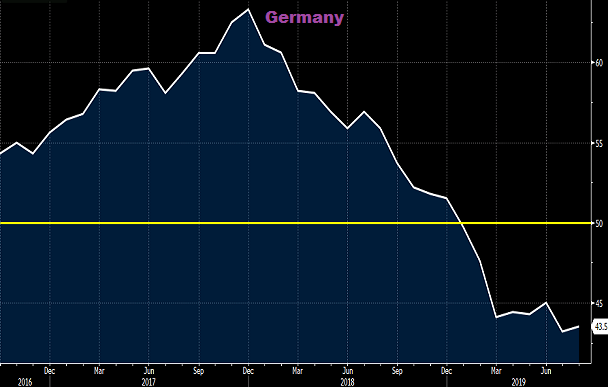
Consider the manufacturing recessions that are burgeoning in Europe. (See the charts below.) Readings below 50 represent contraction.
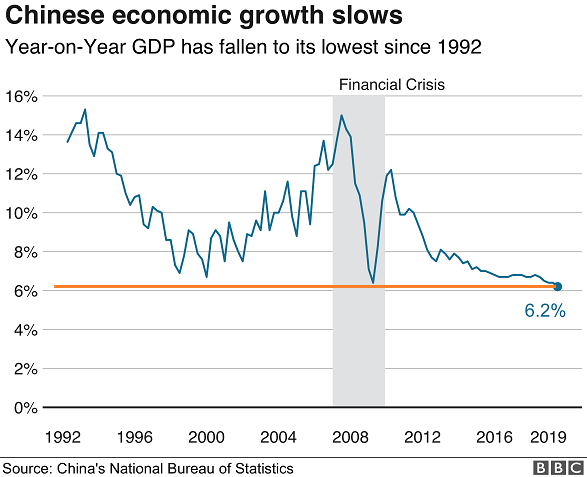
Notice that I have not even mentioned the elephant in the global room: China. The world’s 2nd largest economy is not just our trading partner, but it is pivotal in nearly everything that transpires across the Asia-Pacific region.
The fact that China’s economy is now growing at its slowest pace in 27 years is downright devastating. One might even take notice that the last two times that Chinese GDP fell to these levels — 2000 and 2008 — the U.S. experience significant economic downturns.
Importantly, the U.S. manufacturing segment recently began contracting like the rest of the world. Some may dismiss the reality because we are a consumer-oriented society. Others may point to the recessionary pressures in U.S. manufacturing from 2013 and 2016, where broader based contraction did not come to pass.
There are differences, however. Throughout the early 2010s, the U.S. engaged in “emergency” level stimulus with zero percent rate policy and quantitative easing. In a similar vein, nearly every major central bank in the world “double-downed” on more quantitative easing stimulus (QE) in 2016. What’s more, in 2016, fiscal stimulus via tax cut promises occurred alongside a Republican sweep of the branches of government.
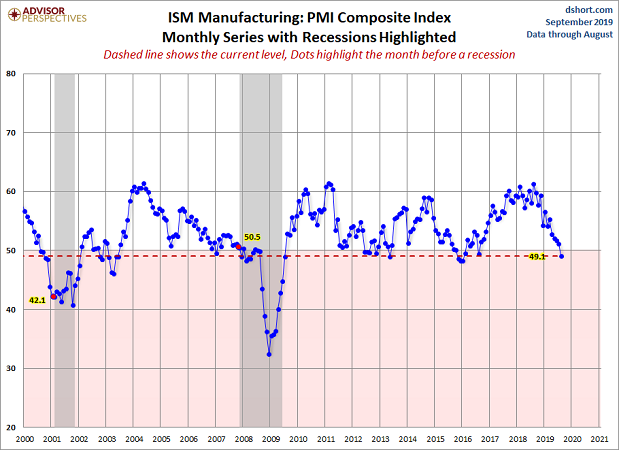
Here in 2019, Congress is unlikely to authorize any fiscal packages prior to the 2020 election. As for monetary stimulus, dissent at the Federal Reserve would likely restrict voting members to a more subtle rate cutting trajectory. They’d require more evidence of an industry-wide recession that has spread beyond manufacturing before throwing in the towel and kick-starting more QE.
Still, it is clear that the U.S. manufacturing slowdown is adversely impacting the U.S. economy at large. Take a look at the rather dramatic slide in S&P 500 per share estimates in 2019.
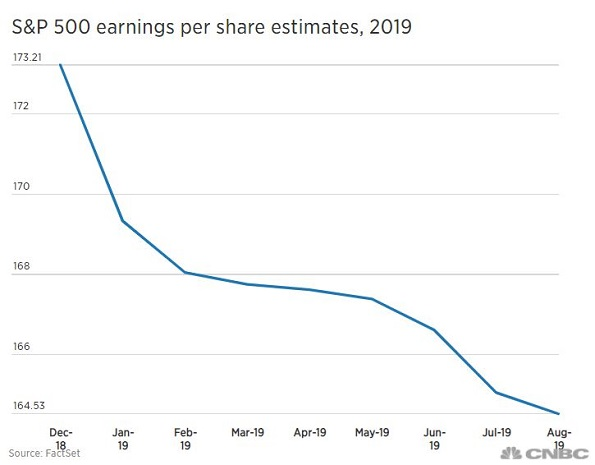
An optimist might choose to look at the absolute levels of the S&P 500. A mere 3% off of all-time highs? Surely U.S. stocks would be down much more than that if we were closing in on an industry-wide recession beyond the manufacturing segment. Wouldn’t they?
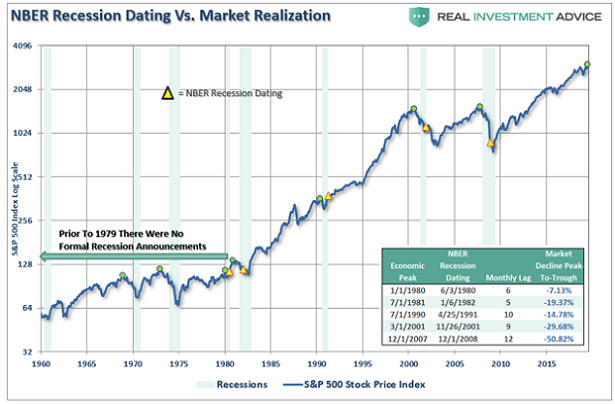
It is worth remembering that the S&P 500 was only 5% off of its all-time record at the time that the Great Recession began in December of 2007. It is also worth remembering that the experts in charge of identifying receptions were nearly 12 months late in declaring the Great Recession’s reception. It was not until 12/1/2008 when NBER finally announced that a recession had started roughly one year earlier.
It is fair to say that we may be underestimating the impact of a worldwide slowdown on the U.S. economy and U.S. asset prices. Some will tell you that $17 trillion in negative interest rate bonds are not suggesting that something’s awry. Others will dismiss the fact that every maturity on the U.S. Treasury curve has inverted below the overnight lending rate.
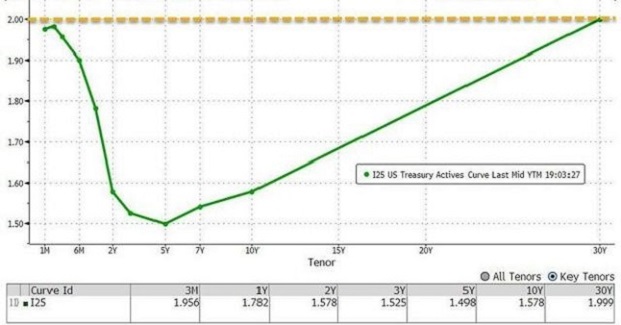
Is the global bond market truly wrong? Or have U.S. large cap stocks simply stayed late at a party that actually ended more than 19 months ago in January of 2018?
Credit spreads between Treasury bonds and corporate bonds tend to widen significantly before a full-fledged recession. One has come to expect a widening of roughly 500 basis points. The reality that spreads remain tight and that a flight away from corporate bonds has yet to occur is a prominent positive for risk takers.
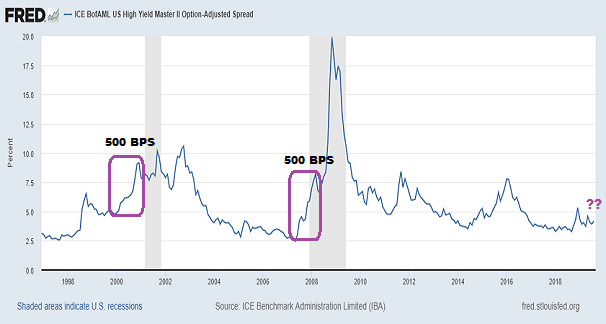
Still, a reversal could happen very quickly. Moreover, the bulk of data, including the resurgence of gold, is hinting at some amount of risk reduction.
For the bulk of my near-retiree and retiree client base, we still maintain roughly 48%-50% in equity, including assets like Vanguard Dividend Appreciation (NYSE:VIG), iShares Minimum Volatility Global (NYSE:ACWV), iShares U.S. REIT (NYSE:USRT) and Vanguard MegaCap (NYSE:MGC). We also see value in a few individual companies like Johnson & Johnson (NYSE:JNJ).
In the income space, we have a wide variety of preferreds, including Van Eck Preferred EX Financial (NYSE:PFXF) and individual names like STANLEY BLACK & DECKER INC 5.75% PRF 2052 (NYSE:SWJ). We’ve also held on to income mainstays such as iShares Core U.S. Treasury (NYSE:GOVT) as well as iShares Aaa-A Rated Corporate Bond (NYSE:QLTA), as well as cash equivalents like SPDR Bloomberg Barclays (LON:BARC) 1-3 Month T-Bill ETF (NYSE:BIL).
Keep in mind, if we believed that we were early in the credit cycle, we would likely be looking for 65% growth/35% income as well as a much wider array of risk assets. However, the likelihood is that we are very late in the credit cycle. This means we are keenly aware of the potential for things to devolve. We would not hesitate to cut our allocation to stocks and other risks if our outlook called for greater portfolio protection.
Disclosure: Gary Gordon, MS, CFP is the president of Pacific Park Financial, Inc., a Registered Investment Adviser with the SEC. Gary Gordon, Pacific Park Financial, Inc, and/or its clients June hold positions in the ETFs, mutual funds, and/or any investment asset mentioned above. The commentary does not constitute individualized investment advice. The opinions offered herein are not personalized recommendations to buy, sell or hold securities. At times, issuers of exchange-traded products compensate Pacific Park Financial, Inc. or its subsidiaries for advertising at the ETF Expert web site. ETF Expert content is created independently of any advertising relationships.
