I’ve said it numerous times in the last few months, 2017 has been the year of setting records. No one said that trading or investing was supposed to be easy. Albeit some have had the false belief that it is draped around them like a warm blanket during the low volatility year we’ve had. Bitcoins have shot up hundreds of percent, U.S. stocks have refused to put in a material decline and we continue to dance as long as the music keeps playing.
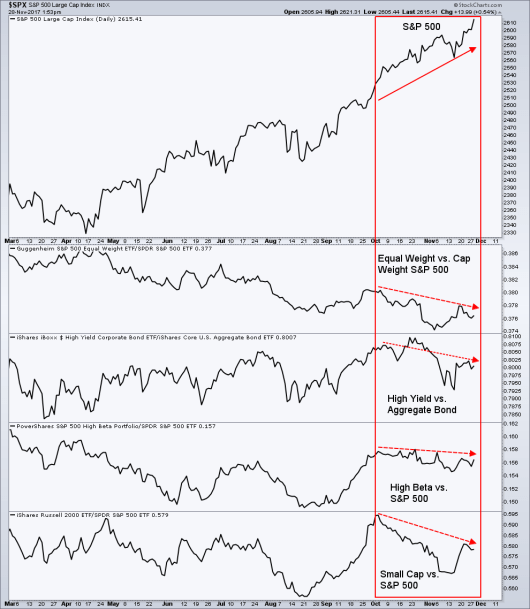
One chart that’s continued to draw my attention is the strength of large cap stocks versus…. well, just about anything else.
This isn’t the first year by any means that we’ve seen focused strength within the market. Just a few years ago in 2013 if you tried to diversify away from U.S. large- or small-cap stocks you were penalized. Large-cap growth was up 33.5% and small caps rose nearly 40%. Even though other markets had a good year, if you went international you underperformed w/ EAFE gaining just 22%, a “diversified” portfolio rose 20% and heaven forbid you owned bonds, which lost 2% that year. (figures from BlackRock). So a year of large-cap strength isn’t anything new and shouldn’t cause too much surprise. But it has because we’ve seen a break from what a commonly healthy market believes about relative performance and risk taking
Turning our attention back to this year and more specifically the last two months. The S&P 500, a cap-weighted index of U.S. stocks has continued to hit new highs as the index most recently moved through 2,600. Meanwhile, many of the other indices that often show positive notes of risk taking have been unable to keep up.
When large caps do well typically the smaller, higher beta/riskier stocks do even better, which we would see in the equal-weighted S&P 500 (RSP) outperforming the cap-weighted SPX. That hasn’t been the case for the bulk of 2017.
What about high-yield bonds? If stocks are doing well then junk bonds should be outperforming aggregate bonds, right? Not for the last two months.
How about high-beta stocks? When U.S. stocks are hitting fresh highs and investors are ratcheting up risk then high-beta stocks should see strength relative to the index…. not for the last two months, no.
Well if large-cap stocks are trending higher then small caps surely are doing even better, because everyone knows that small caps outperform large caps in strong up trends, don’t they? Historically yes, but not for the last two months.

As a technician and a follower of price supply and demand, I find this truly interesting. The market never ceases to amaze.
But is this a concern? yes and no.
When we dig into the internals of the market and look at the breadth of U.S. equities we still have broad participation in the up trend. The various measures of the Advance-Decline Line are still showing confirmation, which means the majority of stocks are still rising – just not as much as the largest of the large caps. As Ari Wald, CMT of Oppenheimer notes with a chart shared by Josh Brown, “Value Line Geometric index, an equal-weighted aggregate of approximately 1,700 companies, has broken above secular resistance dating back to the year 2000.” Many international markets are still in up trends, and we continue to see some degree of sector rotation within U.S. equities, a good sign that the baton is being kept off the ground for the current up trend.
The Takeaway
I think there’s a couple points to draw from the chart above. First, understanding that blindly assuming that if the S&P is doing one thing, then X,Y,Z should also be occurring (i.e. high yield, small cap, high beta outperformaning). Being adaptive to the market environments and the ebbs and flows that come with each year is critical to active management within equities. Second, for the up trend to continue, it would really be nice to see these divergences in relative performance resolve themselves. As we’ve seen with sector rotation, strength rotating to these other barometers of risk taking would be welcomed by many market bulls.
