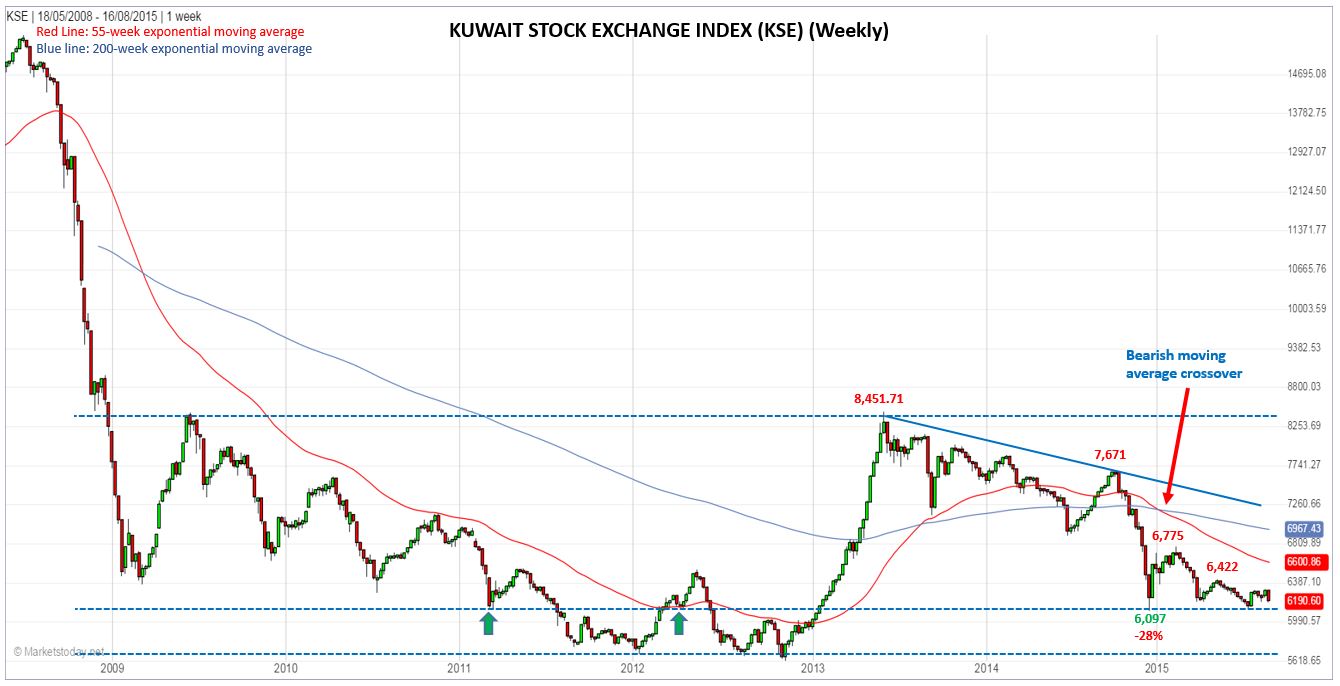
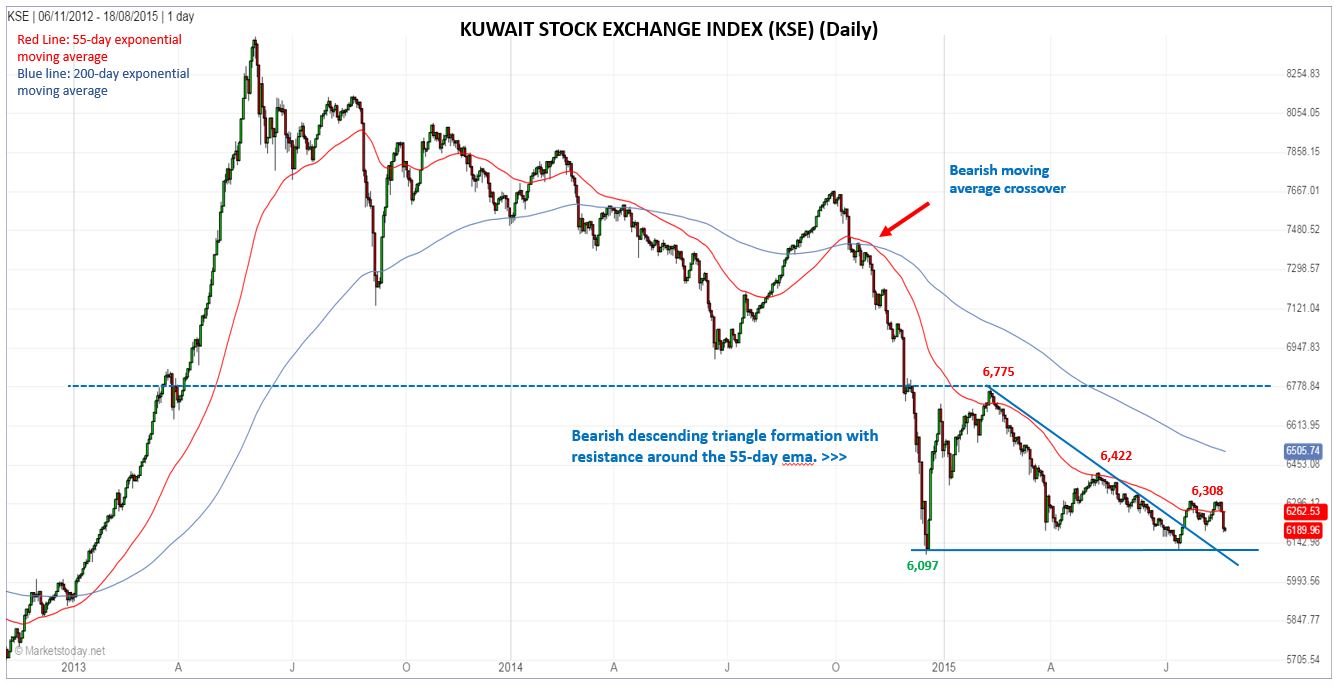
The Kuwait Stock Exchange (KSE) has been trending down since the 2013 top at 8,451.71, falling as much as 28% in 19 months. Support was eventually seen at 6,097 in late-2014, and tested last month with a swing low of 6,112.41. Together, those two swing lows from December to July created a bearish descending triangle trend continuation pattern.

Generally, this pattern can be anticipated to break down. However, in this case what we see is an upside breakout in mid-July, as the KSE rallied above the downtrend line at the top of the triangle. This is a solid trend line as three points are used to define the line thereby increasing the potential significance when it’s busted.

Note that in addition to the downtrend line identifying dynamic resistance of the triangle, the 55-day exponential moving average (ema) has done a good job of identifying trend resistance. Therefore, it becomes an indicator to watch going forward. You can see in the enclosed daily chart it was recently tested twice as resistance, creating a small potential double top in the chart.
A continuation of the upside breakout will be indicated on a rally above the recent 6,308 peak, and confirmed on a move above the 6,422 swing high. That would put the KSE clearly back above its 55-day ema, a bullish sign that the trend may be changing from down to up. The first target is around the 200-day ema, which is now at 6,505.74. Higher up is the top of the triangle at 6,775.
Alternatively, a daily close below 6,097 signals a continuation of the two-year downtrend.
