On Sep 7, The Procter & Gamble Company (NYSE:PG) or P&G highlighted key strategies, at the Barclays (LON:BARC) Consumer Staples Conference, that are resulting in impressive results.
P&G has been able to significantly boost growth on the back of strong brand portfolio, significant productivity improvement, supply chain transformation and organizational changes.
P&G’s products enjoy strong brand recognition and are sold in more than 180 countries. It streamlined its business to focus more on its biggest brands. From 170 brands classified into 16 categories, P&G now has a portfolio of 65 brands organized into 10 categories. We believe that a smaller and more focused company should be able to grow faster, create more value and be much easier to manage. This positions the company for stronger sales and earnings growth.
The company aims to generate up to an additional $10 billion from productivity improvements over the next five years (fiscal 2017-2021) in areas such as supply chain, marketing, digitization and promotional spend effectiveness. P&G’s earlier $10-billion productivity improvement plan that ended in fiscal 2016 has helped the company offset $7 billion of foreign exchange headwinds along with the effects of wage rate inflation and deconsolidation of Venezuela. Over the last four years, adverse foreign exchange has hurt sales by 19%.
Over the last five years, constant currency core earnings per share have grown 11% on average, while core gross margin improved 200 basis points (bps) and core operating margin 270 bps. The company’s aggregate core operating profit margin is the third highest in the industry. Also, it has the second-highest tax profit margin and among the lowest tax rates.
P&G is restructuring its supply chain to lower cost, reduce inventory, improve customer service, set up new multi-category facilities, localize manufacturing and employ smart automation and digitization.
The company has also transformed its organizational structure to a simpler, faster and more accountable one. P&G implemented an end-to-end approach in the United States in fiscal 2016, and added four more markets, including China and the U.K. in fiscal 2017. It also plans to add five markets in fiscal 2018. In smaller countries, the company is going in for a “freedom within a framework” approach, which implies that these markets have “complete freedom to make changes without the need for engagement with regional or global resources,” as long as they are operating within pre-defined strategies and delivering on the financial targets. Since Nov 1, 2015, P&G has yielded total shareholder return of 28% through Aug 18, 2017.
Also, P&G is “raising the bar” in terms of performance through the introduction of superior products, packaging, brand communications, in-store & online execution and consumer & customer value equations. All these strategies are expected to significantly boost growth for P&G.
Stock Performance
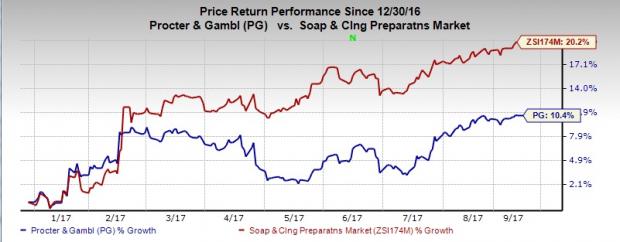
P&G’s shares have gained 10.4% year to date, below the industry’s gain of 20.2%. Although P&G has underperformed the industry so far this year, estimates for the current and next year have moved up 1.5% and 0.5% over the last 60 days, reflecting analysts’ optimism regarding the company. P&G also beat earnings estimates in each of the trailing four quarters. The company’s new product lineup, aggressive marketing, productivity improvement and cost-saving initiatives should boost profits as well.
Zacks Rank & Key Picks
P&G currently carries a Zacks Rank #3 (Hold).
A few better-ranked stocks from the same sector include Pilgrim's Pride Corporation (NASDAQ:PPC) , Sanderson Farms, Inc. (NASDAQ:SAFM) and Unilever (LON:ULVR) N.V. (NYSE:UN) .
Pilgrim's Pride, with a Zacks Rank #1 (Strong Buy), is expected to see 37.1% EPS growth this year.
Sanderson Farms’ EPS is expected to grow 16% in fiscal 2017. The stock carries a Zacks Rank #1. You can see the complete list of today’s Zacks #1 Rank stocks here.
Unilever, with a projected earnings growth rate of 30.1% for 2017, has a Zacks Rank #2 (Buy).
More Stock News: This Is Bigger than the iPhone!
It could become the mother of all technological revolutions. Apple (NASDAQ:AAPL) sold a mere 1 billion iPhones in 10 years but a new breakthrough is expected to generate more than 27 billion devices in just 3 years, creating a $1.7 trillion market.
Zacks has just released a Special Report that spotlights this fast-emerging phenomenon and 6 tickers for taking advantage of it. If you don't buy now, you may kick yourself in 2020.
Click here for the 6 trades >>
Sanderson Farms, Inc. (SAFM): Free Stock Analysis Report
Pilgrim's Pride Corporation (PPC): Free Stock Analysis Report
Unilever NV (UN): Free Stock Analysis Report
Procter & Gamble Company (The) (PG): Free Stock Analysis Report
Original post
Zacks Investment Research
