
Rising interest rates and loan growth drove JPMorgan Chase & Co.’s (NYSE:JPM) second-quarter 2017 earnings of $1.82 per share, which easily surpassed the Zacks Consensus Estimate of $1.57. Also, the figure reflects a 17% rise from the year-ago period. Notably, the results included a legal benefit of $406 million.
Solid loan growth and higher interest rates supported net interest income. Further, investment banking fees recorded a rise. Apart from these, results were supported by a fall in provision for credit losses, mainly driven by reserve releases in the Oil & Gas loan portfolio.
As expected, fixed income and equity trading slumped during the quarter. Also, fall in mortgage banking income, due to higher funding costs and decline in mortgage origination volume, was a headwind. Operating expenses reported a rise during the quarter.
Shares of JPMorgan lost over 1.9% in the pre-market trading. Perhaps, lesser support on the expense front and lower mortgage fees led to investors’ bearish stance. Nonetheless, the actual picture will emerge in the full day’s trading session, with investors and analysts considering the core results.
The overall performance of JPMorgan’s business segments, in terms of net income generation, was decent. All segments, except Consumer & Community Banking, reported a rise in net income on a year-over-year basis.
Among other positives, credit card sales volume improved 15% and merchant processing volume grew 12%. Commercial Banking average loan balances increased 12% and Asset Management average loan balances rose 9%.
Trading Decline Offset by Higher Rates & Loan Growth, Costs Rise
Managed net revenue of $26.4 billion in the quarter was up 5% from the year-ago quarter. Also, it compared favorably with the Zacks Consensus Estimate of $24.8 billion. Rising rates, loan growth and higher auto lease revenues were the primary reasons for the top-line improvement. These were partially offset by lower trading revenues and mortgage banking fees.
Non-interest expenses (on managed basis) were $14.5 billion, a rise of 6% from the year-ago quarter. The increase was primarily due to higher auto lease depreciation, FDIC-related costs and absence of legal benefit recorded in the prior-year quarter.
Improving Credit Quality
As of Jun 30, 2017, non-performing assets were $6.4 billion, down 17% from the year-ago period. Provision for credit losses fell 13% year over year to $1.2 billion, primarily due to reserve releases in Wholesale loan portfolio.
However, net charge-offs were up 2% year over year to $1.2 billion.
Strong Capital Position
Tier 1 capital ratio (estimated) was 14.3% as of Jun 30, 2017 compared with 13.6% as of Jun 30, 2016. Tier 1 common equity capital ratio (estimated) was 12.6% as of Jun 30, 2017, up from 12.0% as of Jun 30, 2016. Total capital ratio came in at 15.9% (estimated) as of Jun 30, 2017 compared with 15.2% as of Jun 30, 2016.
Book value per share was $66.05 as of Jun 30, 2017 compared with $62.67 as of Jun 30, 2016. Tangible book value per common share came in at $53.29 as of Jun 30, 2017 compared with $50.21 as of Jun 30, 2016.
Bottom Line
Improvement in investment banking fees during the quarter is expected to continue in the near term. Moreover, growth in loans and deposits reflects improvement in economy. This is expected to lead to a rise in interest income, which will further benefit from the Fed rate hikes.
However, trading revenue slump owing to low volatility is expected to continue in the near-term. Further, expense control is less likely to support profitability going forward.
J P Morgan Chase & Co Price, Consensus and EPS Surprise
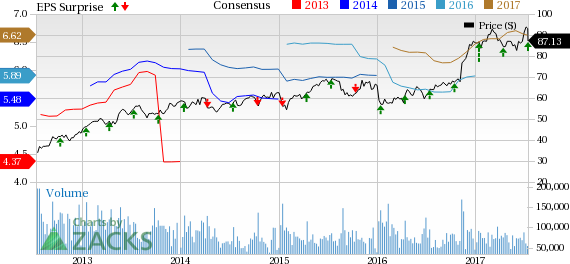
J P Morgan Chase & Co Price, Consensus and EPS Surprise | J P Morgan Chase & Co Quote
Currently, JPMorgan carries a Zacks Rank #3 (Hold). You can see the complete list of today’s Zacks #1 Rank (Strong Buy) stocks here.
Among the other major regional banks, Bank of America Corporation (NYSE:BAC) and Comerica Incorporated (NYSE:CMA) are scheduled to report on Jul 18 while U.S. Bancorp (NYSE:USB) will release its results on Jul 19.
More Stock News: This Is Bigger than the iPhone!
It could become the mother of all technological revolutions. Apple (NASDAQ:AAPL) sold a mere 1 billion iPhones in 10 years but a new breakthrough is expected to generate more than 27 billion devices in just 3 years, creating a $1.7 trillion market.
Zacks has just released a Special Report that spotlights this fast-emerging phenomenon and 6 tickers for taking advantage of it. If you don't buy now, you may kick yourself in 2020. Click here for the 6 trades >>
J P Morgan Chase & Co (JPM): Free Stock Analysis Report
Comerica Incorporated (CMA): Free Stock Analysis Report
U.S. Bancorp (USB): Free Stock Analysis Report
Bank of America Corporation (BAC): Free Stock Analysis Report
Original post
Zacks Investment Research