
Key bank earnings are scheduled for release this Friday. The figures are likely to provide a better understanding of the sector’s prospects in the near future. Banking stocks are expected to gain from recently concluded tax cuts, but not without suffering a short cycle of discomfort. Most of these have already issued a warning about a likely difficult fourth quarter owing to accounting adjustments necessary to adapt to the new tax structure.
For instance, JPMorgan Chase & Co. (NYSE:JPM) has already warned that its fourth-quarter results could be impacted by almost $2 billion due to the new tax law. Wells Fargo & Company (NYSE:WFC) has remained silent on this issue. In this context, key bank earnings scheduled for release over this week and the next, including BlackRock, Inc. (NYSE:BLK) and Citigroup Inc. (NYSE:C) , assume greater significance.
With JPMorgan and Wells Fargo scheduled to report on Jan 12, this may be a good time to consider which of these is a better stock now. Both carry a Zacks Rank #3 (Hold). You can see the complete list of today’s Zacks #1 Rank (Strong Buy) stocks here.
Return on Assets (ROA)
Examining earnings per share alone would not generate any significant insights when determining the level of profitability of a bank. Return on assets is a ratio which reveals how efficiently a bank is utilizing its assets to generate profits.

Currently, JPMorgan holds total assets of $376.5 billion while Wells Fargo has total assets of $305.7 billion. Our research shows that the average one-year trailing 12-month ROA for Wells Fargo is at 1.16%, higher than 1.06% for JPMorgan.
Price Performance
JPMorgan has gained 11.7% over the last three months, outperforming the broader industry which has gained 8.9% over the same period. In comparison, Wells Fargo has not only outperformed the broader industry but is only fractionally behind JPMorgan, gaining 11.6% over the same time frame.
.jpg)
Valuation
Compared with the S&P 500, the broader industry is undervalued. This implies that the industry has the potential to gain in the near future. The industry has an average trailing 12-month P/B ratio – which is the best multiple for valuing banks because of large variations in their earnings results from one quarter to the next – of 1.79. This is below the S&P 500 average of 3.87. Hence, it might be a good idea not to stay away from stocks belonging to this industry.

Coming to the two stocks under consideration, with a P/B ratio of 1.62 JPMorgan is undervalued compared to the S&P 500 and the industry. However, though Wells Fargo is also undervalued compared to the industry and the S&P 500, with a P/B ratio of 1.69, it is marginally pricier than JPMorgan.

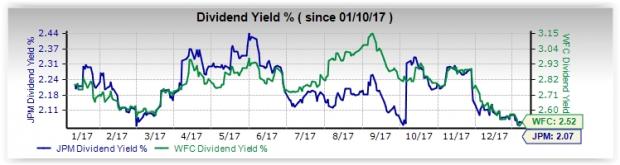
Dividend Yield
Wells Fargo’s dividend yield over a year is 2.52%. With a dividend yield of 2.07%, JPMorgan shareholders fetch a somewhat lower dividend yield than Wells Fargo.
Earnings History and ESP
Considering a more comprehensive earnings history, JPMorgan has delivered positive surprises in all the prior four quarters with an average earnings surprise of 12.8%. Wells Fargo has matched this feat, but with an average positive earnings surprise of 2.8%, it loses this round to its larger rival. But the situation changes when considering Earnings ESP values, with JPMorgan clocking in at -0.62% while Wells Fargo’s reading stands at +0.76%.
Conclusion
Our comparative analysis shows that JPMorgan holds an edge over Wells Fargo when considering a more detailed earnings history. Both stocks are neck to neck when considering price performance and valuation. However, Wells Fargo is superior when considering return on assets and dividend yield.
Additionally, it carries a positive ESP reading unlike JPMorgan. Both stocks have a the same Zacks Rank and seem to be evenly matched but Wells Fargo is preferable ahead of earnings, since it holds a clear edge in the Earnings ESP stakes.
Zacks’ Best Private Investment Ideas
While we are happy to share many articles like this on the website, our best recommendations and most in-depth research are not available to the public.
Starting today, for the next month, you can follow all Zacks' private buys and sells in real time. Our experts cover all kinds of trades… from value to momentum . . . from stocks under $10 to ETF and option moves . . . from stocks that corporate insiders are buying up to companies that are about to report positive earnings surprises. You can even look inside exclusive portfolios that are normally closed to new investors.
Click here for Zacks' private trades >>
J P Morgan Chase & Co (JPM): Free Stock Analysis Report
Wells Fargo & Company (WFC): Free Stock Analysis Report
Citigroup Inc. (C): Free Stock Analysis Report
BlackRock, Inc. (BLK): Free Stock Analysis Report
Original post
Zacks Investment Research