⏳ Final hours! Save up to 60% OFF InvestingProCLAIM SALE

Jack In The Box’s 2017 Forecast Misses The Mark

Published 11/21/2016, 11:22 PM
Updated 05/14/2017, 06:45 AM
US500
-
JACK
-

Jack In The Box Inc (NASDAQ:JACK) late Monday posted mixed fourth quarter results and offered a somewhat tepid outlook for 2017.

The San Diego-based company reported adjusted Q4 net income of $1.03 per share, which was significantly better than the $0.88 expected by analysts. Revenues rose 12.5% from last year to $398.42 million, slightly worse than Wall Street’s $398.58 estimate.

Looking ahead, JACK forecast full-year 2017 earnings-per-share (EPS) to range from $4.55 to 4.75, which could miss the $4.75 estimate of analysts.

Same-store sales, a key measure of a restaurant chain’s health, rose 2% across all Jack in the Box system stores. Jack in the Box stores saw a 0.5% increase in same-store sales, with a 3.5% rise in the average check size. At the company’s Qdoba burrito chain stores, same-store sales rose +0.8% system-wide. Those gains were driven by higher traffic and rising catering demand.

JACK forecast Q1 same-store sales to grow 2% to 4% at Jack in the Box system restaurants, up from a +1.4% gain last year. At Qdoba, the company sees same-store sales of “approximately flat to up +1%” at Qdoba company restaurants, which indicates a slowing growth rate from last year’s 1.5% increase.

For the full year 2017, Jack in the Box sees same-store sales increasing about 2% to 3% at Jack in the Box system restaurants, and similar growth at Qdoba company restaurants.

The company commented via press release:

We are happy with the progress we made on our key strategic initiatives during the year, as we made significant headway on reducing our G&A, increased our borrowing capacity to support our capital structure goals, and began implementing plans to increase the franchise mix at Jack in the Box to over 90% of the system.

Jack in the Box shares fell $1.90 (-1.87%) to $99.75 in after-hours trading Monday. Prior to today’s report, JACK had risen 32.23%, more than four times the return of the benchmark S&P 500 during the same period.
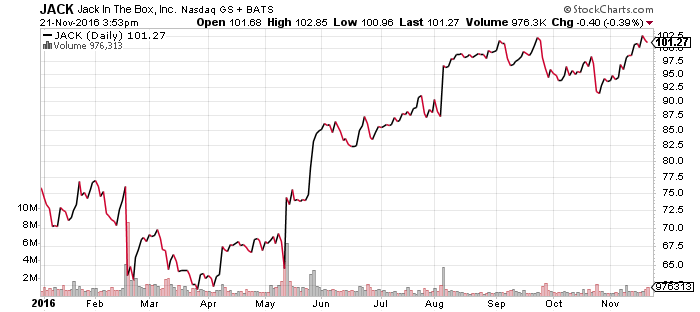
JACK Daily Chart

Latest comments

Loading next article…
Risk Disclosure: Trading in financial instruments and/or cryptocurrencies involves high risks including the risk of losing some, or all, of your investment amount, and may not be suitable for all investors. Prices of cryptocurrencies are extremely volatile and may be affected by external factors such as financial, regulatory or political events. Trading on margin increases the financial risks.
Before deciding to trade in financial instrument or cryptocurrencies you should be fully informed of the risks and costs associated with trading the financial markets, carefully consider your investment objectives, level of experience, and risk appetite, and seek professional advice where needed.
Fusion Media would like to remind you that the data contained in this website is not necessarily real-time nor accurate. The data and prices on the website are not necessarily provided by any market or exchange, but may be provided by market makers, and so prices may not be accurate and may differ from the actual price at any given market, meaning prices are indicative and not appropriate for trading purposes. Fusion Media and any provider of the data contained in this website will not accept liability for any loss or damage as a result of your trading, or your reliance on the information contained within this website.
It is prohibited to use, store, reproduce, display, modify, transmit or distribute the data contained in this website without the explicit prior written permission of Fusion Media and/or the data provider. All intellectual property rights are reserved by the providers and/or the exchange providing the data contained in this website.
Fusion Media may be compensated by the advertisers that appear on the website, based on your interaction with the advertisements or advertisers.
© 2007-2024 - Fusion Media Limited. All Rights Reserved.