
Jack in the Box Inc. (NASDAQ:JACK) reported first-quarter fiscal 2019 results, wherein both earnings and revenues surpassed the Zacks Consensus Estimate. Following the quarterly results, shares of the company increased 4.2% in after-hours trading. However, the stock has lost 10.6% against the industry’s 13.7% growth in the past six months.
Adjusted earnings from continuing operations came in at $1.35 per share, which exceeded the Zacks Consensus Estimate of $1.30 and increased 9.8% on a year-over-year basis. Also, total revenues of $290.8 million outpaced the consensus mark of $286 million but decreased 1.2% year over year.
Comps Discussion
Comps at Jack in the Box’s stores inched up 0.5% compared with the prior-year quarter’s 0.2% growth. Average check growth of 3.8%, partially offset by a 3.3% decline in transactions led to the improvement. In fourth-quarter fiscal 2018, the company had reported comps growth of 0.8%.
Same-store sales at franchised stores declined 0.1% compared with a 0.3% decline in the prior-year quarter. In the last reported quarter, the metric rose 0.4%. System-wide same-store sales decreased 0.1% compared to a 0.2% decline in the prior-year quarter. In fourth-quarter fiscal 2018, system-wide same-store sales increased 0.5%.
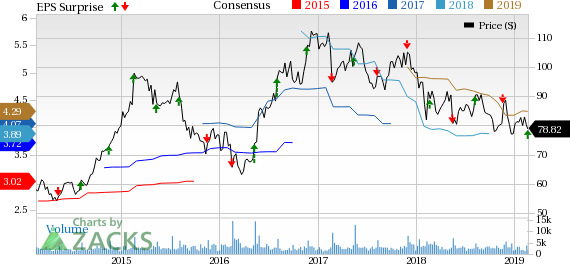
Jack In The Box Inc. Price, Consensus and EPS Surprise
Operating Highlights
Jack in the Box’s consolidated restaurant operating margin was 22.8%, up 60 basis points (bps) year over year.
Restaurant-level EBITDA increased 20 bps from the year-ago quarter to 26.2%. The upside was driven by benefits from refranchising, partially offset by wage inflation as well as an increase in repairs and maintenance costs. Meanwhile, franchise EBITDA was 42.9% compared with 60.9% in the prior-year quarter. Rise in costs in the current quarter resulted in the downside.
Balance Sheet
As of Jan 20, 2019, cash totaled $4.3 million compared with $3.8 million as of Jan 21, 2017. Inventories in the quarter under review amounted to $2.1 million, up from $1.9 million at the end of Sep 30, 2018.
Long-term debt summed $1,013.7 million as of Jan 20, 2019, compared with $1,037.9 million at the end of Sep 30, 2018. Cash flows from operating activities declined to $37.6 million in the first quarter from $53.7 million at the prior-year quarter end.
The company did not repurchase any shares in the first quarter. Currently, it has $101 million left under the current authorization.
2019 Outlook
Jack in the Box reiterated its fiscal 2019 guidance. Comps at the company’s system restaurants are envisioned to be in the range of flat to up 2%. Meanwhile, the company continues to expect Restaurant-Level EBITDA within the 26-27% band.
Adjusted EBITDA is anticipated between approximately $260 million and $270 million. Capital expenditures are estimated roughly in the range of $30-$35 million.
Zacks Rank & Key Picks
Jack in the Box carries a Zacks Rank #3 (Hold). Better-ranked stocks in the same space include Brinker International, Inc. (NYSE:EAT) , El Pollo Loco Holdings, Inc. (NASDAQ:LOCO) and Darden Restaurants, Inc. (NYSE:DRI) , each carrying a Zacks Rank #2 (Buy). You can see the complete list of today’s Zacks #1 Rank (Strong Buy) stocks here.
Brinker International has an impressive long-term earnings growth rate of 14.5%.
El Pollo Loco Holdings delivered positive earnings surprise in three of the trailing four quarters, the average beat being of 5.5%.
Darden Restaurants reported better-than-expected earnings in three of the trailing four quarters, the average beat being 4%.
Today's Best Stocks from Zacks
Would you like to see the updated picks from our best market-beating strategies? From 2017 through 2018, while the S&P 500 gained +15.8%, five of our screens returned +38.0%, +61.3%, +61.6%, +68.1%, and +98.3%.
This outperformance has not just been a recent phenomenon. From 2000 – 2018, while the S&P averaged +4.8% per year, our top strategies averaged up to +56.2% per year.
See their latest picks free >>
Darden Restaurants, Inc. (DRI): Free Stock Analysis Report
Jack In The Box Inc. (JACK): Free Stock Analysis Report
Brinker International, Inc. (EAT): Free Stock Analysis Report
El Pollo Loco Holdings, Inc. (LOCO): Free Stock Analysis Report
Original post
Zacks Investment Research