iShares Russell 2000 (NYSE:IWM) has been trading according to the Elliott Wave, Fibonacci and Gann rules. In the next 2 charts, we will provide a medium-term outlook for IWM and a possible time target for this bullish cycle.
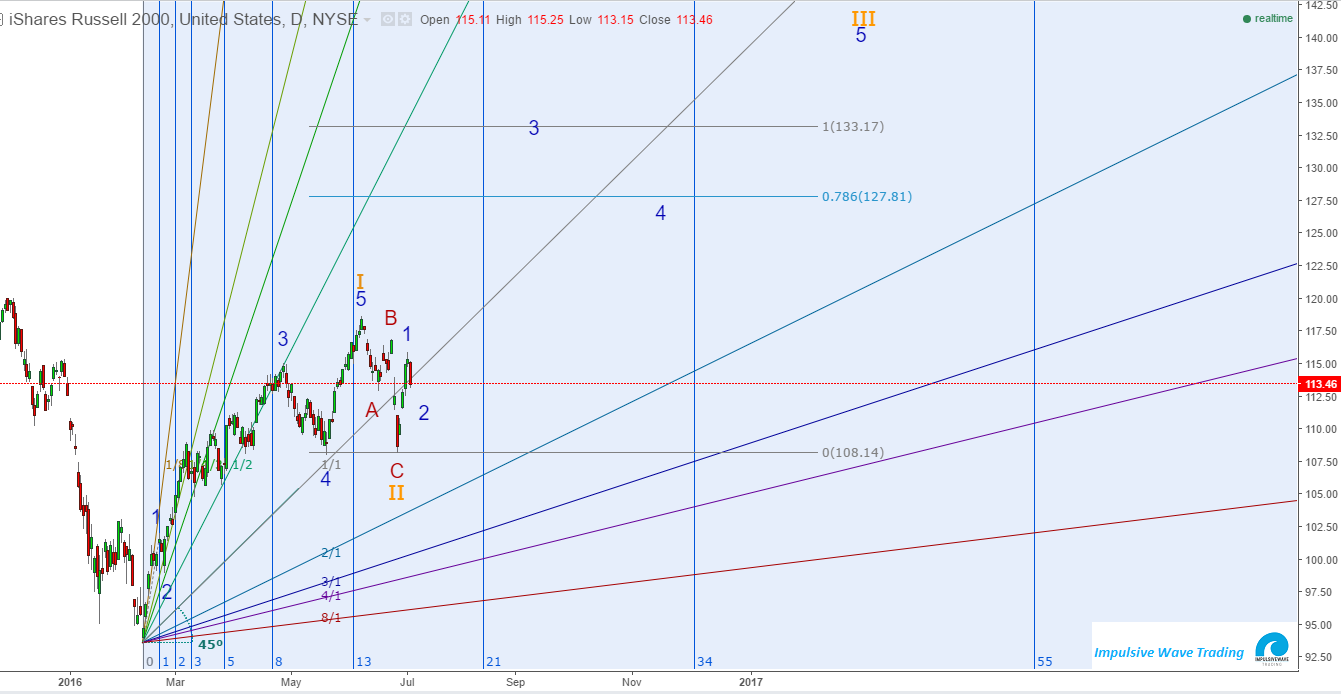
IWM Daily Chart - July 05, 2016, Elliott Wave Count
In this daily chart, we clearly see that IWM has the same structure as SPX and completed wave II during the Brexit vote. Now, we expect this inner wave 2 (blue) of wave III to make a higher low and target 50%-62% retracement level of blue wave 1.
In the next weeks, IWM will jump above the 1-1 Gann angle in order to resume the bullish trend that will target first 100% extension level at $133.00 and then 162% extension level at $148.50. But, how long can this process take in order to achieve its objective?
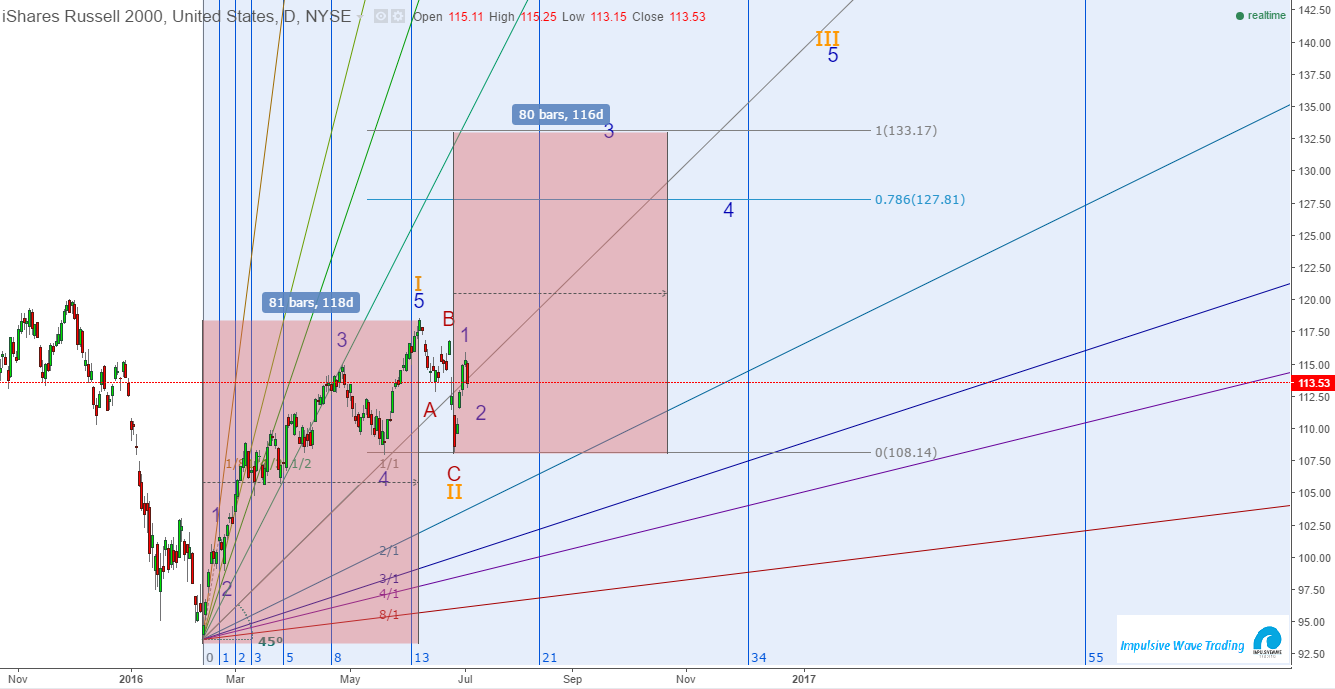
IWM Daily Chart Projection - July 05, 2016, Elliott Wave Count
In this chart, we have projected the time length of blue wave 3 of orange wave 3 that needs to target 100% extension level (in prices terms). So, price and time is 1-1. The same amount of days or bars it took orange wave I to complete, the same amount of time (ideally) orange wave III needs. But, according to EW Rules, wave 3 always extends more than 100%, thus that exact time is going to be only wave 3-III.
In the last days of October 2016, wave 3 of III is projected to complete or IWM is projected to target $133 price level.
Invalidation point remains at the $108 price level, and a breach below will only extend orange wave II. Unless that happens, IWM has higher levels to test until end of year.
