Animal spirits are impossible to predict.
The equity market is running on fumes of optimism and, perhaps more so, fear of missing out. When these types of animal spirits are driving prices it is nearly impossible to predict where the mania ends. Tech stocks, mostly Tesla (NASDAQ:TSLA), have experienced exuberance not seen since 2000. We all know how that ended.
While we don't necessarily expect such a hard landing, we also know making money in stocks isn't a given. And when the masses assume there is no downside risk in holding stocks, particularly tech stocks, there is bound to be a reality check. For instance, there are masses of young adults with access to the Robinhood app looking to change their lives with stock purchases. It could be argued that Tesla's parabolic rally was partly due to the newfound market access provided to Millenials via mobile apps. If you don't believe me take a stroll into twitter or facebook; trading groups and profiles are flooded with "get rich quick" attitudes regarding the stock market.
Treasury Futures Markets

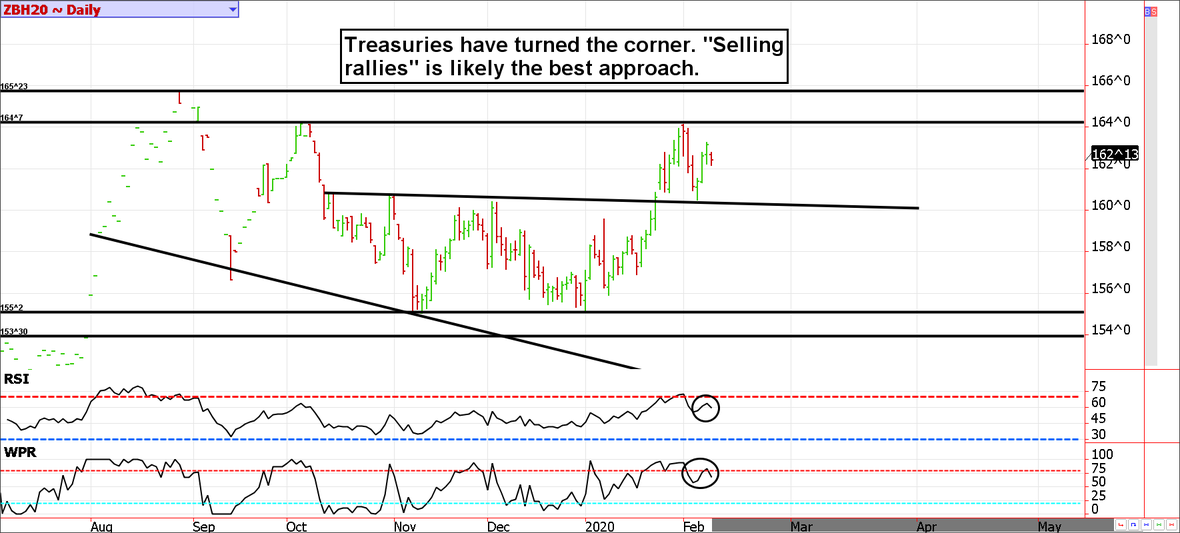
It is hard to believe bonds and notes are elevated with stocks at all-time-highs.
Who could have predicted the financial market chaos Central bankers around the world would create with easy money policies. Of course, the alternative (financial collapse) would have been much worse than the inconvenience of unconventional markets. Nevertheless, everything we learned in college finance classes should be forgotten.
The Fed has made it clear, they are not looking to lower rates any time soon. The economy is "the best ever" (not true on most metrics but it is certainly doing well). Seasonality is bearish and yields are unattractive. In short, there are very few good reasons to be bullish in Treasuries.
Treasury futures market consensus:
Being bearish on rallies in notes and bonds feels like the way to go for now.
Technical Support: ZB : 156'30, 155'02 and 153'30 ZN: 130'06, 128'23, 128'00, 127'08, 126'06.
Technical Resistance: ZB: 164'07, 165'04, and 167'09 ZN: 132'06 and 133'0

Stock Index Futures
The VIX might be low, but intraday volatility is high.
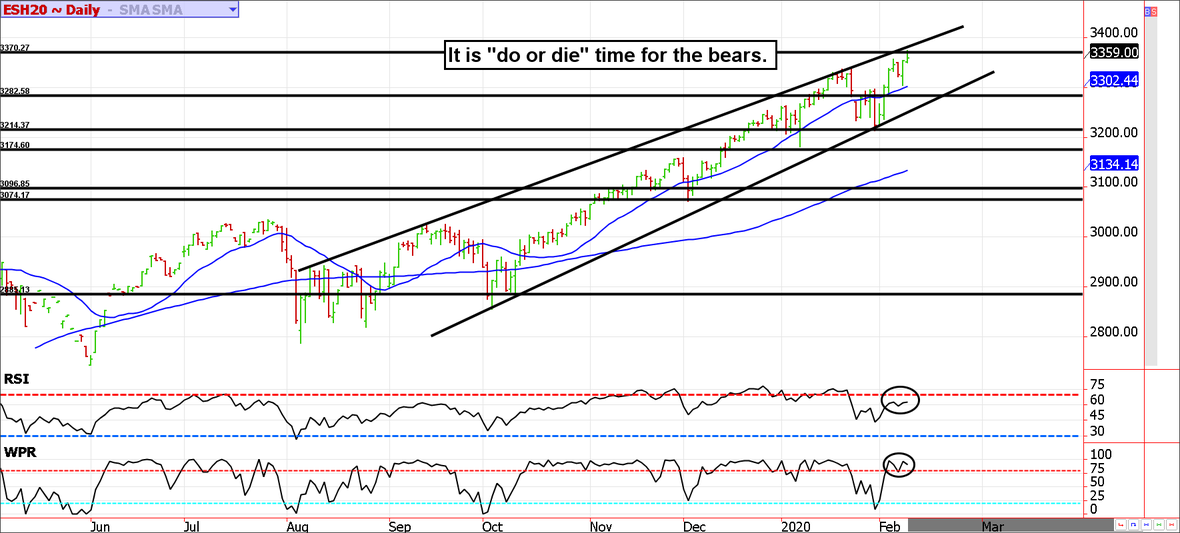
The VIX is a widely accepted measure of stock market volatility. It is based on the implied volatility built into S&P 500 options. However, because of the volatility skew in stocks (they go down faster than they go up), the VIX decreases as stocks go up and it increases as they go down. However, this only tells part of the story. For instance, in the current environment, we are seeing the March S&P move 30.00 to 70.00 points in a few sessions. Although the direction is higher, the volatility is quite intense.
This is important because short-sellers are often lulled into complacency, which in turn adds fuel to the buying frenzy as they cover their positions. Further, it should also be noted that irrational price swings are what tops and bottoms are made of.
If we weren't so deep into coronavirus peril in the commodities, we would advocate adding to bearish ES positions up here.
Stock index futures market consensus:
3370/80 resistance must hold or stocks could go the way of Tesla.
Technical Support: 3302, 3263, 3210, 3182, 3126, 3074, 2885
Technical Resistance: 3380 and 3405
E-mini S&P Futures Day Trading Ideas
These are counter-trend entry ideas, the more distant the level the more reliable but the less likely to get filled
ES Day Trade Sell Levels: 3382 and 3405
ES Day Trade Buy Levels: 3340 (minor), 3315, 3254, 3235, 3208, 3183, 3126, 3101, and 3074
In other commodity futures and options markets...
September 12 - Roll the September Bloomberg Commodity Index into the December contract.
December 13 - Roll the December Bloomberg Commodity Index into March.
February 21 - Exit half of the Bloomberg Commodity Index futures position (we added on a dip in January).
June 14 - Roll BCI into the September contract and double the quantity (to dollar cost average).
July 25 - Go long the euro currency using a micro futures contract.
September 25 - Buy January orange juice 110 calls for about 2.50 ($375).
October 28 - Sell S&P 500 futures in a SMALL way using Micro E-mini or E-mini depending on account size and risk tolerance.
November 7th - Add to micro ES short future position (double the current quantity).
December 3 - Offset half of the short S&P positions.
December 4 - Offset cattle spread to lock in moderate loss (about $300 for most before transaction costs).
December 9 - Roll December euro into March.
December 9 - Roll December BCI into March.
December 13 - Roll December Micro E-mini S&P into March and double the quantity.
January 3 - Go long mini natural gas futures near $2.10.
January 8 - Sell April crude oil 69/52 strangle and buy the March 73/50 strangle to act as catastrophic insurance for a net credit of about $930 before transaction costs.
January 15 - Sell April hog 66 puts and buy February hog 60 puts for a credit of about $700 before transaction costs.
January 15 - Buy back short call leg of crude oil spread to lock in gain of about $600 to $700 (we are holding the rest of the trade).
January 16 - Go long May corn, hedge the position by purchasing a May 3.70 buy and paying for it with the sale of a May 4.10 call.
January 15 - Sell May wheat 6.20 call and buy the March 6.30 call to collect about 12 cents.
January 27 - Buy March soybean 9.10 calls near 5 cents.
January 31 - Exit short wheat call spread to lock in a quick gain.
January 31 - Offset half of the micro ES futures near 3255.
February 5 - Roll Feb hog 60 put into a 57 put to lock in a gain on the insurance while keeping a hedge in place.
February 10 - Roll March crude oil 50 put into the 48.50 to lock in a gain on the hedge and reduce theta risk.
DeCarley Trading (a division of Zaner)
Twitter:@carleygarner
info@decarleytrading.com
Due to time constraints and our fiduciary duty to put clients first, the charts provided in this newsletter may not reflect the current session data.
Seasonality is already factored into current prices, any references to such does not indicate future market action.
There is substantial risk of loss in trading futures and options.
** These recommendations are a solicitation for entering into derivatives transactions. All known news and events have already been factored into the price of the underlying derivatives discussed. From time to time persons affiliated with Zaner, or its associated companies, may have positions in recommended and other derivatives. Past performance is not indicative of future results. The information and data in this report were obtained from sources considered reliable. Their accuracy or completeness is not guaranteed. Any decision to purchase or sell as a result of the opinions expressed in this report will be the full responsibility of the person authorizing such transaction. Seasonal tendencies are a composite of some of the more consistent commodity futures seasonals that have occurred over the past 15 or more years. There are usually underlying, fundamental circumstances that occur annually that tend to cause the futures markets to react in similar directional manner during a certain calendar year. While seasonal trends may potentially impact supply and demand in certain commodities, seasonal aspects of supply and demand have been factored into futures & options market pricing. Even if a seasonal tendency occurs in the future, it may not result in a profitable transaction as fees and the timing of the entry and liquidation may impact on the results. No representation is being made that any account has in the past, or will in the future, achieve profits using these recommendations. No representation is being made that price patterns will recur in the future.
