My nightly newsletter's current focus is on picking leading stocks with high odds of generating 20-30% gains over a period of several weeks to months.
Since large-cap stocks tend to move slowly, small- and mid-cap growth stocks comprise a majority of the trades we make in most years.
And thanks to exciting, bullish charts of the small- and mid-cap indexes right now, 2017 could be even more awesome than usual.
Whether you are a short-term trader or long-term investor, keep reading to see why small- and mid-cap stocks deserve a front-row seat in your portfolio.
Small- And Mid-Cap Charts: No Resistance, No Problem!
Thanks to a powerful, news-driven rally last November, the broad market kicked off 2017 on a positive note.
However, small- and mid-cap stocks have clearly been setting the pace and are exhibiting the most relative strength of the major indices.
Notably, both the small-cap Russell 2000 and S&P Midcap 400 indices have recently broken out to fresh, all-time highs.
Stocks and indexes trading at record highs tend to continue much higher, even with minimal demand, due to a complete lack of overhead supply (resistance) from higher price levels.
But the best breakouts to new highs also have lengthy bases of prior price consolidation (which subsequently becomes new support after the breakout).
So, did the small-cap and mid-cap index breakouts meet that qualification as well? Absolutely!
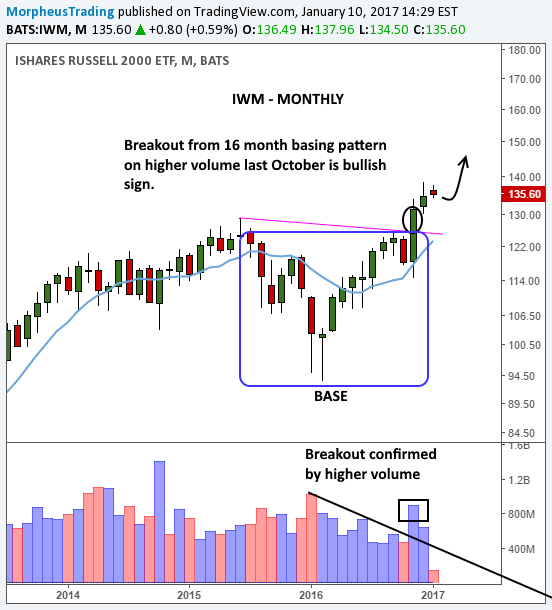
Take a look at the long-term, monthly chart of iShares Russell 2000 (NYSE:IWM), a popular ETF proxy for the small-cap Russell 2000 index:

As shown on the chart above, IWM recently rocketed to a new all-time high after finding major support at its rising 10-month moving average (similar to 200-day MA) last November.
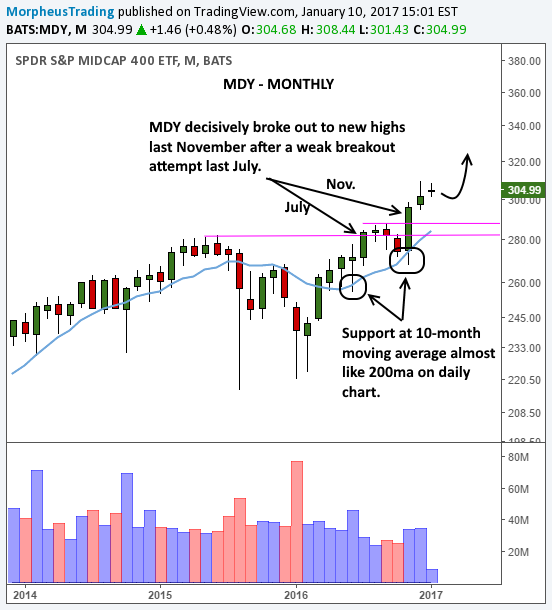
It’s a similar situation with SPDR S&P MidCap 400 (NYSE:MDY), an ETF proxy that tracks the S&P Midcap 400 Index:

S&P Midcap 400 failed a breakout attempt in July of 2016, but succeeded during its subsequent breakout attempt four months later.
As with IWM, the breakout occurred after the ETF came into key support of its 10-month moving average, and was confirmed by increasing volume on the breakout.
Behemoth Base = Beastly Breakout
The longer the base of consolidation, the stronger the eventual breakout will be.
This is a well-known “rule” of technical analysis that is quite reliable (except in bear markets).
Accordingly, the most powerful index and stock breakouts are typically preceded by solid, lengthy bases of consolidation.
How do the recent breakouts in IWM and MDY measure up in that regard?
If we include the sideways action in 2014 that stalled out with very little upside in 2015, then IWM is breaking out from a three-year long base.
MDY has a similar chart pattern, although its base of consolidation is closer to two years (around twenty months).
Since these record high breakouts were preceded by both long bases of consolidation AND pullbacks to major support of the 10-month moving averages, small- and mid-cap stocks may score an excellent performance in 2017!
Armed with such knowledge, it may be a great idea to increase the small and mid-cap stock allocation in any traditional investment accounts (IRA, 401k, etc.) you manage.
Although all signs point to prevailing small and mid-cap strength throughout 2017, please keep in mind that bullish chart patterns have a very low chance of success in bearish markets.
Therefore, keep an eye on the overall health and sentiment of the broad market.
This can be accomplished by simply monitoring the price action of leading stocks in the market.
As long as we don’t start seeing a bunch of failed breakouts in the top growth stocks, it’s probably safe to say overall market sentiment is okay.
