Commodity Comeback
Recency bias is a funny thing. It’s human nature to expect the near future to look like the recent past. But we all know that’s not how things always play out. And that can be costly, even dangerous, for investors.
Take long term bonds, for example. 10-Year Treasury yields have more than tripled, from 0.54% to 1.66% since last July. Does that mean the 40-year bond bull market is dead?
Tough to say, or course. We’ll only know that for sure with hindsight. You know… recency bias.
If nothing else, the bond market is telling us price inflation is becoming a thing again, notwithstanding what the Fed might be telegraphing.
According to the Consumer Price Index (CPI), the 12-month change in February was 1.7%. And yet, if you use electricity, gasoline, pay rent or even eat, chances are your experience has been quite different.
Energy, real estate, Lumber, agriculturals, metals and beyond are all on fire since last March.
Is this the start of a new commodities super cycle? It’s certainly looking that way.
Signals Flashing Inflation
Like I said, the bond market, for one, is catching serious sniffs of price inflation. If I had to guess why, stimulus, money-printing, near-zero and negative rates, plus massive pent-up post COVID-19 demand would be top of mind.
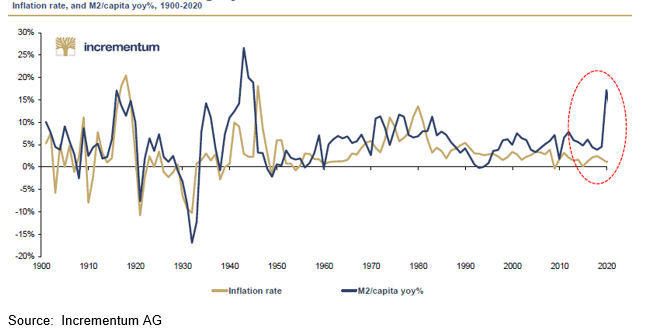
Monetary growth has already far outpaced levels from the 1970s. And we know that inflation follows the money supply, often with a lag.

Money velocity has fallen steadily since the 2008-2009 financial crisis, but it’s absolutely plummeted since the start of the pandemic. Is that about to change in a dramatic way? Before you decide, remember recency bias.
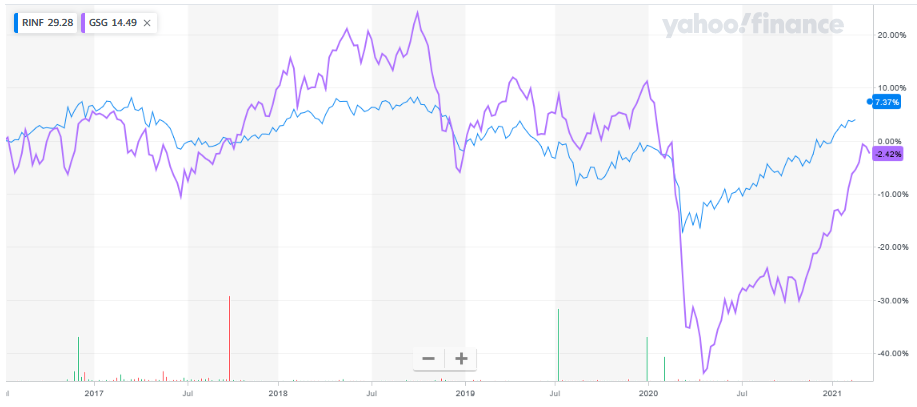
Despite low money velocity, a funny thing has happened. Commodities have been soaring along with inflation expectations.

One of the best ways to know where a sector stands in the bigger picture is to compare it to other assets. And looking back over longer periods of time often provides great perspective. That’s why I absolutely love this next chart.
Commodities Rising
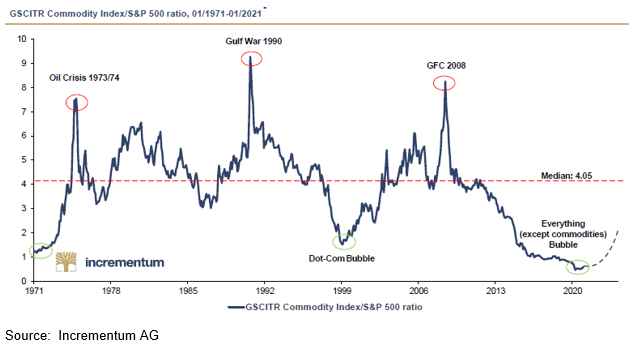
It’s the ratio between the S&P Goldman Sachs Commodity Index and the S&P 500.
Looking back all the way to 1972, commodities have never been cheaper relative to the broad stock market. Never. The average of this ratio is 3.9 over 50 years. Today, it sits near 0.5. But it seems poised to soar.

For commodities just to make it back to their average levels versus stocks, they will need to rise by almost 700%. And remember, that’s the overall index, and it’s the underlying commodities. Needless to say, some commodities will outperform others.
But the companies involved in producing those commodities will do even better as their profits leverage rising revenues.
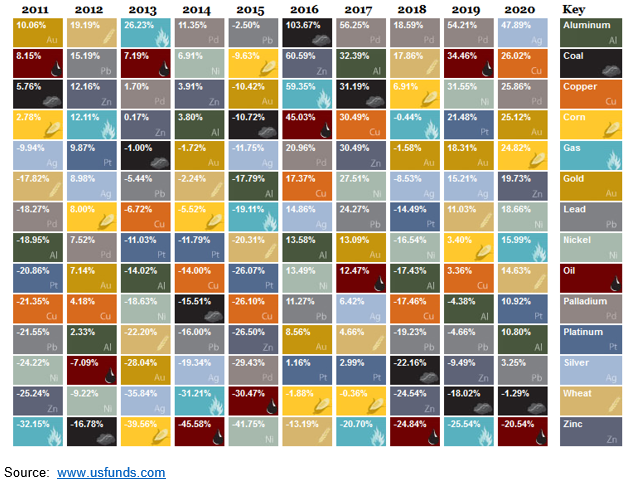
The following table lays out the annual performances of a number of commodities.

As you can see, in 2020 nickel was up 19%, corn gained 25%, while palladium and copper both gained 26%. In a recent 2021 Commodities Outlook: REVing up a structural bull market (Nov. 18, 2020), Goldman Sachs said:
“Looking at the 2020s, we believe that similar structural forces to those which drove commodities in the 2000s could be at play.”
A commodities super cycle is considered to be a multi-decade trend, where a wide range of basic resources enjoy rising prices thanks to a structural shift in demand versus supply. Typically, what happens, is that supply stagnates or drops for several years as economic demand is itself weak or constant. However, at one point a new business cycle starts, and demand picks up, while supply is unable to immediately react.
Producing most commodities is a highly capital-intensive endeavor. That means a lot of money to build and ramp up production, not to mention the delays in finding, permitting, and building any new projects. Typical delays can be on the order of 10 years or more.
With supply unable to meet growing demand, prices rise. It’s Economics 101. So producers of those commodities enjoy higher revenues, and higher profits as their costs remain fixed or rise more slowly than the underlying commodity. And as profits expand, so do their share prices. You have a solid trend for years as supply struggles to catch up to demand. It’s a secular bull market.
What’s sowing the seeds for a new commodities super cycle? The drivers are numerous, which reinforces the probabilities. First we have a shift. In the above table, 12 of the 14 commodities ranked showed gains last year. In 2019, it was just 9. In 2018, just the top 3 commodities eked out a gain.
Then we have all the usual suspects: near zero interest rates and bond-buying from central banks, massive government spending and deficits, ongoing printing to increase the money supply exponentially, stimulus checks being given to the majority of the population, huge infrastructure, green energy, and COVID-19 fighting and relief spending.
Oh, and possibly a long term bear market in the U.S. dollar in which commodities are priced. Plus all the pent up demand from people unable to go out and spend due to pandemic restrictions. I believe the large gains in base metals and energy over the past year are the markets sensing that a flood of consumption and inflation are coming our way.
And Goldman Sachs is not alone. Bank of America has also forecast a surge in commodity prices as a result of post-pandemic global economic recovery. JPMorgan said in a recent note that metal, energy and agricultural prices are reaching multi-year highs, signaling a commodity super cycle that may last for several years.
I agree. That’s why it’s time to position for a new commodities super cycle. After all, the action in commodities looks and quacks like a duck.
Don’t be a victim of recency bias.
