I read an individual's commentary this weekend that was titled Is This As Good As It Gets, and I will have more comments on this later in this post, but it coincides with some clients/investors inquiring whether they should raise cash now. The 'raise cash now' question is certainly understandable when one looks at the strength of the market since the February low last year, up nearly 40% on a price only basis in less than two years.
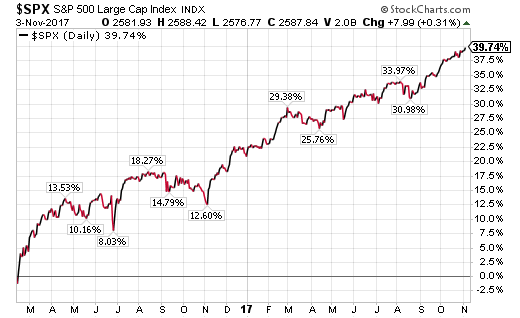
As I have noted in some recent posts, the most recent one here, the important thing investors should do at this point in time is review their overall asset allocation. If the market strength has caused the equity exposure to exceed ones comfort level, now is a good time to adjust their portfolio by reducing equity back to a comfortable target. Instead of having maybe three or so months of liquidity to fund expense needs, maybe that liquidity should be increased to nine to twelve months if that enables you to sleep better at night. Timing the market is difficult, time in the market is important.
The author of the commentary noted at the beginning of the post is Jeff Miller and he writes a weekly article referred to as Weighing The Week Ahead and it is a worthwhile weekly read. This week's commentary noted many positives from economic ones to corporate earnings. In his 'Final Thoughts' section he concludes:
"Can we expect to identify market tops from the record strength in economic indicators? No...
"When indicators and markets finally roll over and get worse, we will be able to look back and spot the “top.” That is much different from a real-time forecast. The current level of economic strength can continue or improve – perhaps for years. Many pounce on the first decline in an indicator and leap to an unwarranted conclusion.
"Trying to guess the top (or bottom) from improving (or worsening) indicators is a fool’s errand.
"Stocks are driven by earnings and interest rate expectations. These factors remain favorable..."
The last highlight above from Jeff's article notes the importance of earnings and interest rates. He references an earnings analysis by Brian Gilmartin of Trinity Asset Management. What is interesting from Brian's analysis this week is the fact, Thomson Reuters, one of the keepers of earnings data, notes in its report that forward 4-quarters earnings are expected to grow 10.58% versus the report from a year ago. He states,
"In essence, what it tells us is that the “one-year forward” S&P 500 earnings estimate is growing at a slowly accelerating pace. The point of this for readers is that – while earnings data isn’t a timing tool, or acts with precision relative to the market, usually when you get an increasing growth rate like we’ve seen, we should get “P.E expansion” in the S&P 500. Except we haven’t."
Although Brian says we should not draw too much from accelerating earnings growth and no or little P/E expansion, I believe it is important that growth in the market is trending in line with the earnings growth rate. Brain notes a market 'froth' indicator is rapid expansion in the P/E multiple and that is not occurring.
On the interest rate front, short term rates are rising faster than long term rates and an inverted yield curve could be an unfavorable factor for the equity market as the last seven recessions were preceded by an inverted yield curve. An inverted curve does not always indicate a recession is forth coming though as noted by the inversion in late 1966 and the flat curve in 1998. The flattening yield curve occurring in this cycle is certainly worth watching, but as the below chart shows, the spread between the 2-Year and 10-Year US Treasury is sufficiently wide that an inversion is unlikely near term, all else being equal. 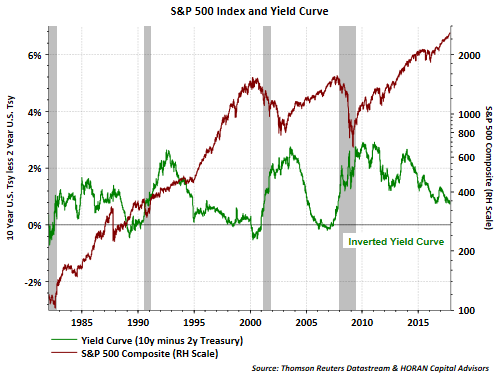
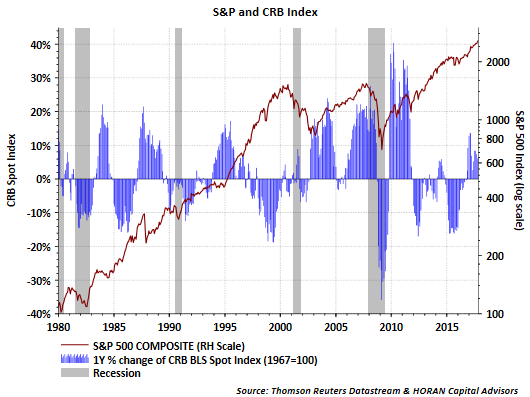
And finally, an update on some recent economic data points beginning with a look at the below chart showing the CRB Spot Index and the S&P 500 Index. The CRB Index looks at "22 sensitive basic commodities whose markets are presumed to be among the first to be influenced by changes in economic conditions. As such, it serves as one early indication of impending changes in business activity." All six of the commodity group indices, like metals, raw materials, etc, continue to show year over year growth, which is partly a function of demand and supports the conclusion of positive or expanding economic activity.
As the manufacturing size of the economy has declined, it is important to look at the non-manufacturing sector as well. Last Friday's ISM Non-Manufacturing Index report of 60.1 showed exceptional strength. The index has recorded only three higher readings since the late 1990's. 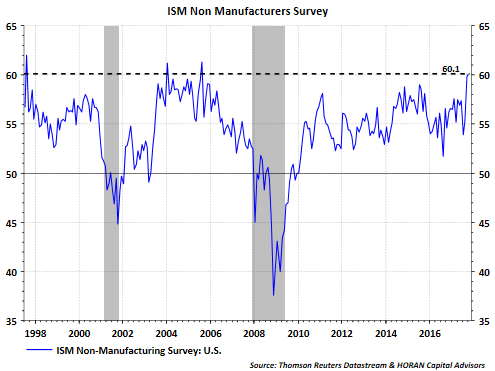
As Jeff Miller noted in his Weighing The Week Ahead Post, Is This As Good As It Gets, some economic and company reports "cannot get much better". Global activity seems to be synchronized in a positive direction though.
Just as a handful of large caps stocks dominated returns in 2015, the same appears to be occurring again this year as the cap-weighted S&P 500 Index is outperforming its equal weighted counterpart, Guggenheim Invest S&P 500 Equal Weight (NYSE:RSP).
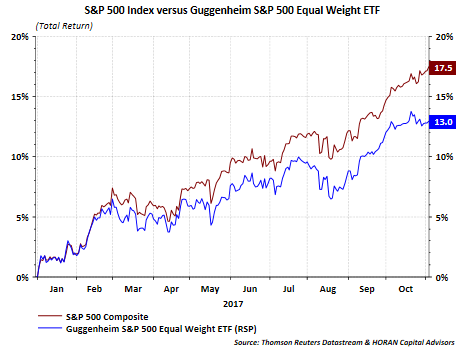
The point for investors is attractive investments may be found outside of just the megacap stocks. Evaluating ones risk tolerance versus their asset allocation is a good step at this point in the market cycle.
