Is this rally for real? This is the question of the moment and the week ahead should hopefully hold a number of answers for traders.
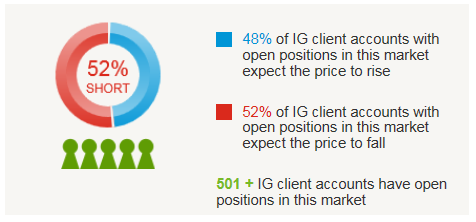
Assessing price action, behavioural analysis and fund flow data will be key. This should give traders an understanding of whether the rally has further legs. From what we are seeing on the first day of the trading week, profit taking has been the order of the day, although our client base is moderately short risk markets (52% of all open positions on the S&P/ASX 200 held short, 77% S&P, 69% FTSE, 82% AUD/USD) and generally positioned for downside from here. China is the outlier, with the CSI 300 rallying 2.5% helped by commentary that the stock market sell-off behind us and a belief of near-term easing.

The latest report around fund flows and the Commitment of Traders (CoT) data shows positioning only as of last Tuesday, which doesn’t give us a full reflection of where we currently are. What we actually saw last week was speculative funds increasing net short positions of S&P futures by 22% (the most since January 2012), while investors withdrew $5 billion from US equity funds. Given the moves from Tuesday (when funds have to report their exposure), I will be especially interested in positioning in S&P 500 futures, which one would expect to see strongly reduced.
The same could be said in AUD/USD short positioning, with the speculative community still net short 40,809 futures contracts (as of Tuesday).
Implied volatility in the S&P 500 (as measured by ‘VIX’ or the US volatility index) fell 18.4% last week and has now fallen for nine consecutive days. In Australia, the same can be said of the ASX ‘VIX’, which fell 17.5% last week and is up 1.7% today, ending an eight-day fall. If we throw in a 1.4% fall on the week in the broad trade-weighted USD, we’ve ultimately seen the Bloomberg financial conditions index move back into positive/expansionary territory for the first time since August. Let’s see how financial conditions stand at the end of the week, as there is much for traders to digest this week and we may find that those who have closed out hedges may be looking to redeploy.
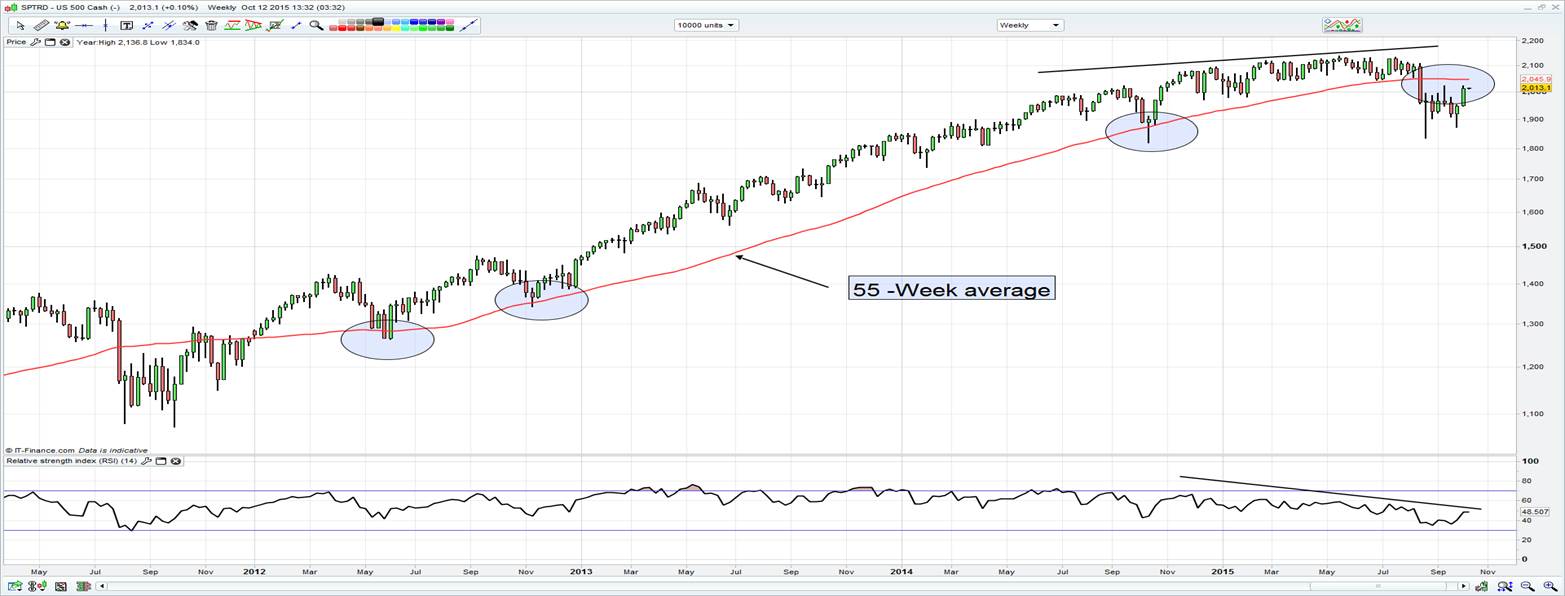
Technically, the bulls will want to see the MSCI World index continuing printing higher highs, after pushing to the highest levels since August last week. Moves in the S&P 500 will under pin that, but there is so much significant technical resistance seen between 2020 to 2033 (the 17 September pivot high to the 61.8% retracement of the August to September sell-off) that the bulls may have a tough time from here. It may be that these are better levels to redeploy shorts. Moving out the time frame, I have also been closely watching the 55-week moving average (now seen at 2045 – see chart below).
This average effectively contained the sell-offs and proved to be the key ‘buy’ zone from May 2012. However, after closing below this average in mid-August, the index is looking for a re-test. A rejection of this level (if it gets there) would be very telling and could have strong negative ramifications for risk assets if it defines any future downtrends.

What’s on the radar this week?
US politics is back in the market’s sights, with the Democratic presidential debate on Wednesday (12:00 AEDT) and much speculation about Paul Ryan reluctantly putting himself forward for the House Speaker role. The debt ceiling debate is on the radar and we are back to watching yields on short-term debt, specifically T-Bills maturing in December, to gauge an idea about real systemic risks in the US.
We’ve already seen 5% of the S&P report earnings, with 70% having beaten on earnings and 58% on the top lines. On the docket this week, we see numbers from Johnson & Johnson (N:JNJ), Intel (O:INTC), JP Morgan, Bank of America (N:BAC), Wells Fargo (N:WFC), Netflix (O:NFLX), Citigroup (N:C), Goldman Sachs (N:GS) and General Electric (N:GE). We know the bar has been lowered, but are the bulls too reliant on a better-than-expected Q3 earnings season?
With the USD under pressure and breaking a number of recent trends, the key data points for the week to focus on will be the US September retail sales, Beige book and core CPI (expected to be 1.8%). The market is expecting a 30 basis point increase in the retail control element (the part of sales that filter directly in the GDP calculation) and this could have further implications for Q3 GDP (announced on 29 October). The market is looking for 2% growth in Q3; however, given what we have seen of late, 2% still feels punchy.
Federal Reserve speakers include Brainard, Evans, Lockhart, Bullard and Dudley. There has been a marked pick up on the prospect of negative rates, although most still expect a tightening of monetary policy to occur in Q1.
We’ve seen net selling of AUD/USD today, which isn’t that aggressive after last week’s strong rally and subsequent break of the 18 September high ($0.7280). The key behind further upside will be price action in the commodity complex and implied volatility. Lower volatility leads to traders deploying carry structures and looking for higher yielding assets, which leads to AUD and NZD outperformance.
In Australia, the big data release is the September employment report, with expectations of 9600 net jobs created and an unchanged unemployment rate of 6.2%. China’s financing numbers, inflation data and trade figures should also effect sentiment as well. Keep in mind there are elevated expectations of a near-term cut in China Reserve Ratio Requirements (RRR).
On the whole I am sceptical of chasing the equity rally. I would be tightening up stops on long positions, but it doesn’t feel right to look at aggressive short positions either. Consolidation therefore seems the most likely path this week.
UK inflation and wage data (consensus at +3.1%) could drive the sterling. Watch for a weekly close below the 7 August low of A$2.0874, for a move into $2.0600.
