A lot happened over the last few days. Let’s start with the analysis of fresh economic data.
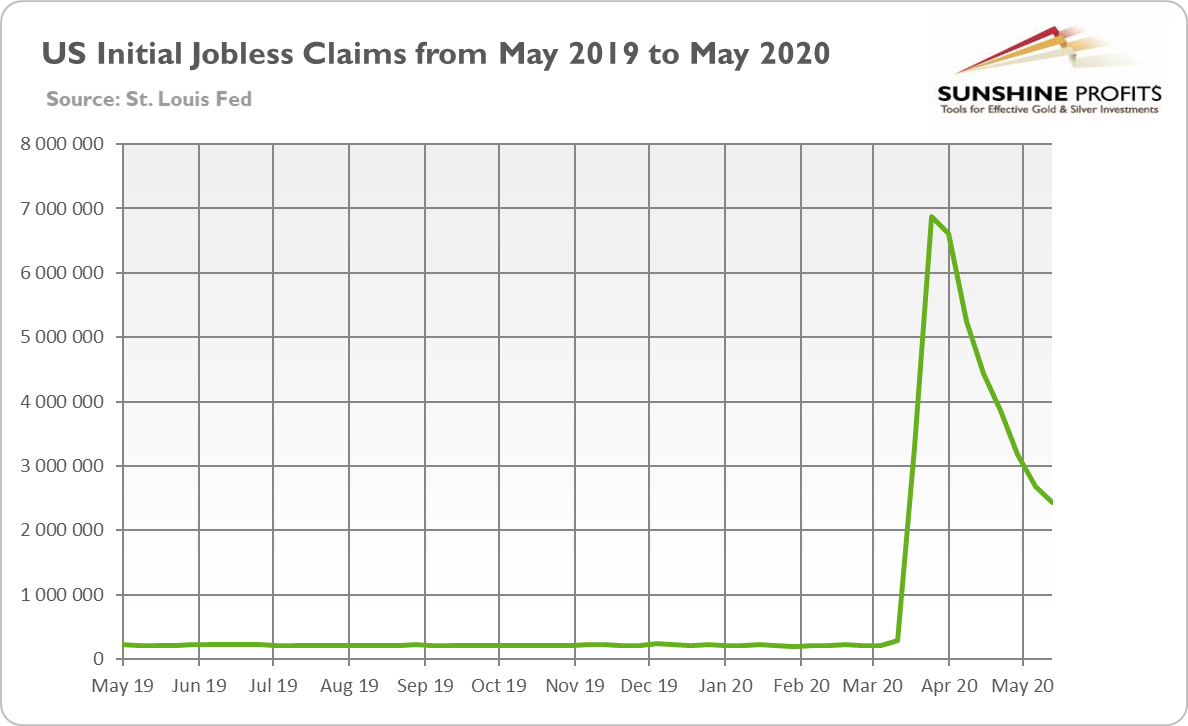
First, the initial jobless claims came in at 2.4 million in the week from May 9 to May 16, as the chart below shows. While the number of Americans who applied for the unemployment benefit have declined for seven straight weeks following the peak of 6.9 million in late March, it is still a mammoth figure, much higher than before the pandemic (when about 200,000 people used to apply for the unemployment benefit each week).

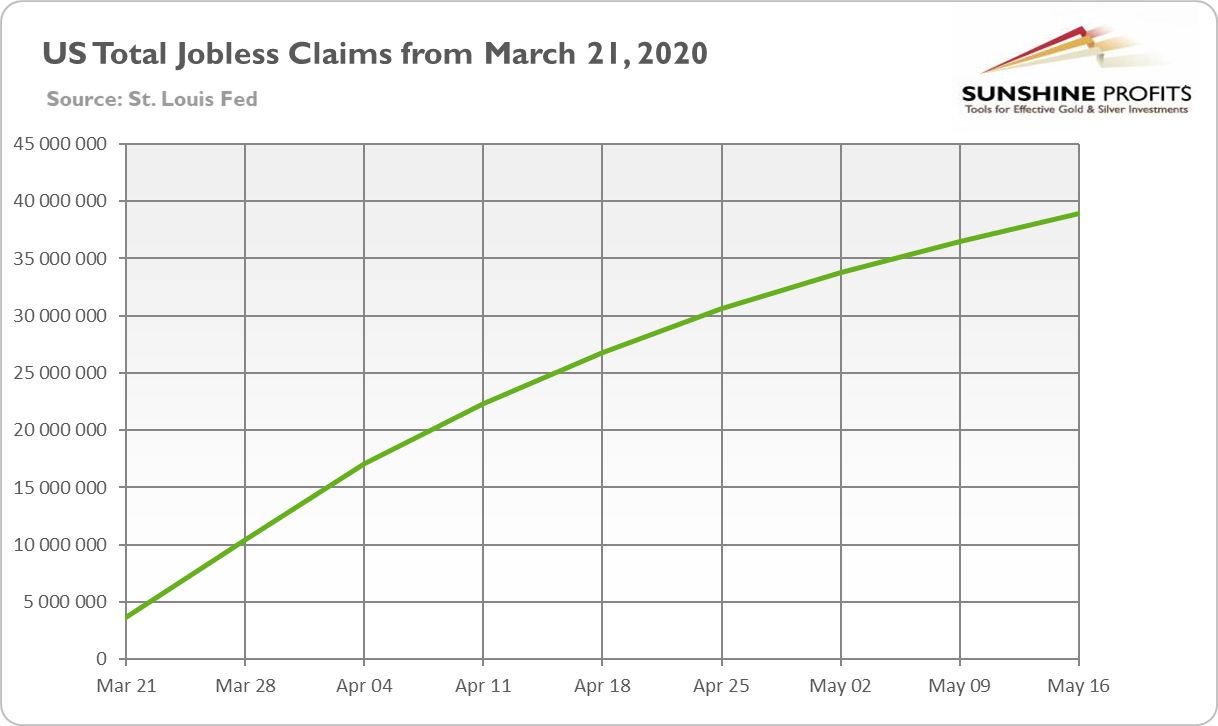
It means that the devastation in the U.S. labor market has been unprecedented. As the chart below shows, almost 39 million people claimed benefits since the beginning of the epidemic, which implies that the unemployment rate is comparable now to the rate seen during the Great Depression, or even higher! Importantly, the trend of total claims since March 21 is still rising strongly, which means that the recovery is so far weak, despite the partial reopening of the economy.

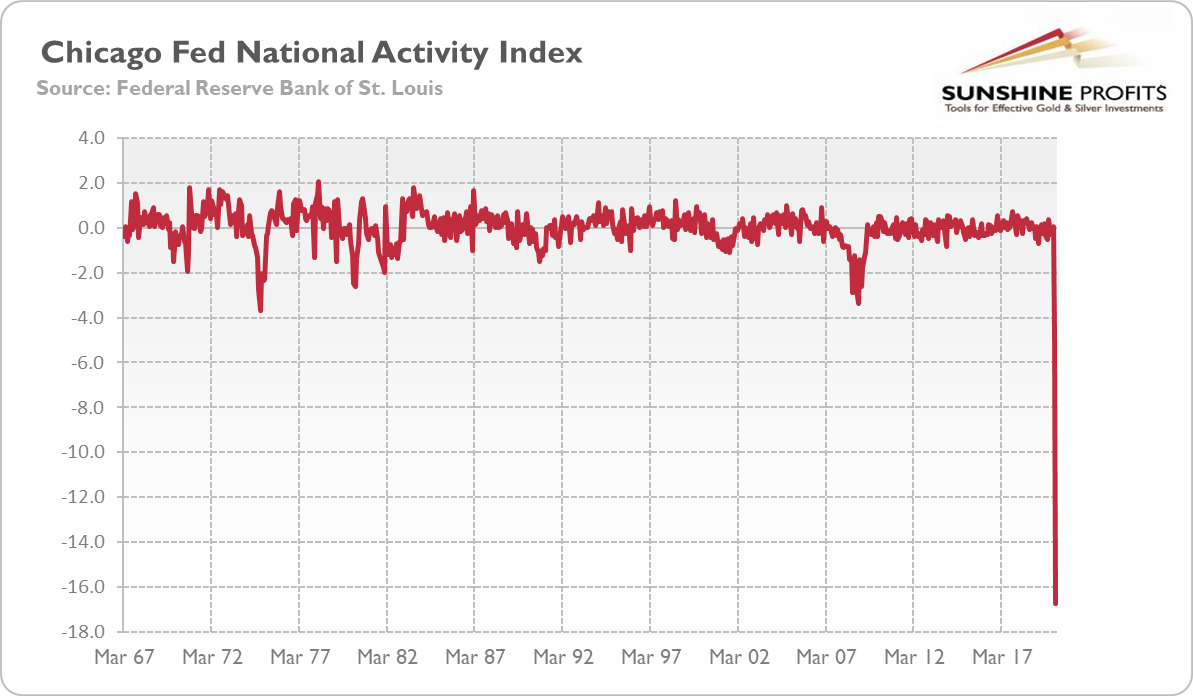
Second, the Chicago Fed’s national activity index, which measures whether the economy expands above or below the average growth, declined from a negative 4.97 in March to a negative 16.74 in April. The number is the worst in the data series history which begins in 1967, easily surpassing the disaster of the Great Recession, as the chart below shows.

However, the situation has improved somewhat in May, at least according to regional manufacturing surveys.
For example, the Philadelphia Fed Manufacturing Index rose from -56.6 in April to -43.1 this month. The reading is still terrible, but less so than one month ago. Similarly, the New York Empire State Index rebounded from -78.2 in April to -48.5 in May.
The latest PMI data from the IHS Markit also show some improvement. The flash manufacturing purchasing managers index rose from 36.1 in April to 39.8 in May, while the flash services purchasing managers index increased from 26.7 to 36.9. It means that the worst is probably behind us.
Implications for Gold
What does the recent bunch of data imply for the U.S. economy and the gold market?
Well, it seems that the rate of economic collapse has peaked in April. This is probably why the stock market rallied this week, with S&P 500 reaching the psychologically important level of 3,000. People become more optimistic with the number of infections of the coronavirus under control and relaxed containment measures. And a further planned easing will help the economy further, but demand could remain weak with some restrictions and social distancing remaining in place. In other words, the U.S. economy should rebound later this year, but is not out of the woods yet – so the pace of recovery may be slower than the most optimistic investors hope for.
In other words, the stock market may be priced for an economic recovery that the data so far does not support. The initial crash was an overreaction, so now investors look for sparkles of hope everywhere. For sure, there are many reasons for being optimistic, but the war with coronavirus is not over. So, there might be some correction in price as investors could go into risky assets, but gold still seem to be a rational addition to the portfolio. Given that second-order effects (think about the consequences of high debt, geopolitical repercussions or the possibility of corporate bankruptcies, etc.) have not been probably fully priced in yet, and that it’s very difficult to predict them, the significant portion of the safe-haven demand for gold should remain in place.
Disclaimer: Please note that the aim of the above analysis is to discuss the likely long-term impact of the featured phenomenon on the price of gold and this analysis does not indicate (nor does it aim to do so) whether gold is likely to move higher or lower in the short- or medium term. In order to determine the latter, many additional factors need to be considered (i.e. sentiment, chart patterns, cycles, indicators, ratios, self-similar patterns and more) and we are taking them into account (and discussing the short- and medium-term outlook) in our trading alerts.
