The study of “gamma” has become a topic du jour in many different forms of financial media.
In the past year, The Wall Street Journal and Bloomberg published articles which seem to have kicked off a popular interest in “market gamma” —something which many professional traders had already been aware.
The study of market gamma – in its essence – is the study of market risk. When market gamma is relatively high (or low), we can say that financial risk is also high (or low). The study of market gamma can provide context for mean-reversion events, Black Swan events, and intra-day volatility.
What I like most about the study of gamma is that it is based upon actual bets in the options markets—where millions of dollars are exchanging hands. I view gamma to be the ultimate “smart money” indicator.

Gamma Neutral in the S&P 500
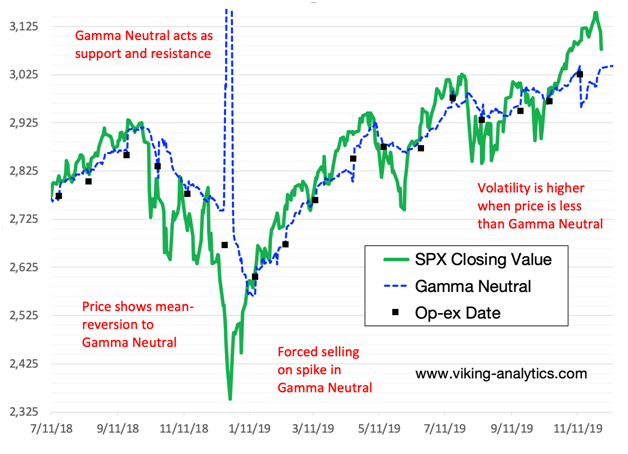
Different traders and analysts look at risk (and gamma) in different ways. I have developed a system that calculates a (theoretical) market price that results in total market gamma equal to zero. I chart and track levels of Gamma Neutral in many different markets. This is a difficult concept to conceptualize, and I won’t attempt to unpack it all in this article.In my study of Gamma Neutral in the S&P 500, I can demonstrate four different occurences:
- Gamma Neutral often acts as support and resistance, similar to a moving average;
- The value of the S&P 500 mean-reverts to Gamma Neutral, often prior to key monthly option expiration date;
- When Gamma Neutral spikes out of range of price (such as in December 2018), it highlights the potential for forced selling (or forced buying) to cover off-sides options bets.
- Over our evaluation period, the next day volatility in the S&P 500 is higher when price closes below Gamma Neutral.
All of these phenomena are shown in the graph below.
What Does it Mean For the S&P Today?
While there are certainly other factors in the market beyond gamma analysis, I see the following points as relevant:
- The recent divergence was the most extreme divergence since last December, when the market sold off considerably (perhaps helped along at that time by forced selling).
- If price holds here and continues to grind higher, then due to the gamma imbalance we could see the opposite price action of last year – a short-covering spike.
- If Gamma Neutral continues to rise while the market declines, it means that the options market is “buying the dip” from a risk perspective.
- I anticipate support if price falls to Gamma Neutral. This can be explained in part by machine-trading delta-hedging programs.
- If price declines below Gamma Neutral prior to the December 20th option expiration date, then I would expect volatility to increase.
