The Dow Jones Industrial Average usually gets the most attention, but it is the Dow Jones Transports that often gives the early signs of trouble. Transport and delivery companies are the first to find out when there is a slowdown in global trade. And in some cases, a slowdown evolves into a full-blown recession.
Despite all the factors suggesting a recession is clearly on the horizon, no-one can actually tell when it will begin. In fact, it usually takes at least a few months before the economists, who rely on past economic data, finally find out that a recession had started.
So instead of waiting for the next GDP report, let’s take a look at the Dow Jones Transports from an Elliott Wave perspective.

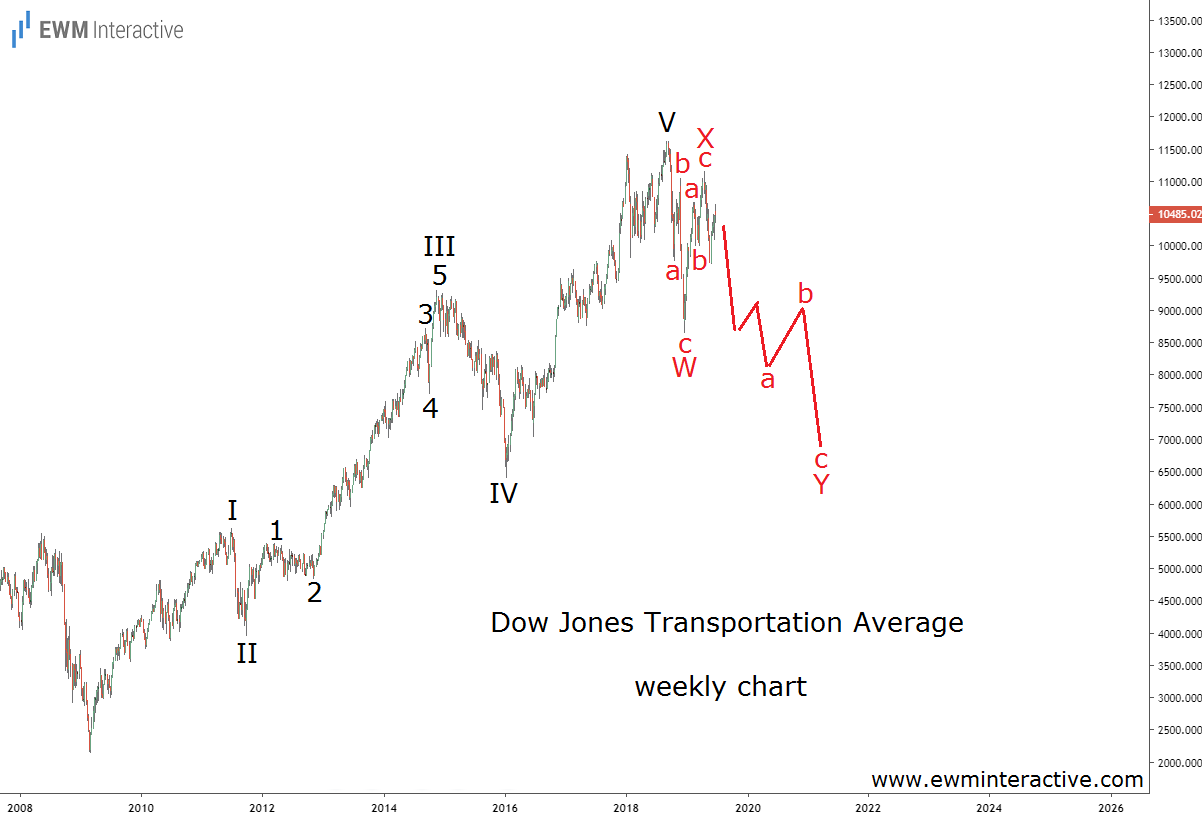
The weekly chart of the Transportation average reveals the structure of the entire bull market since March 2009. As visible, it has formed a textbook five-wave impulse. The pattern is labeled I-II-III-IV-V, where the sub-waves of wave III can be seen as well.
According to the theory, a three-wave correction in the opposite direction follows every impulse. And indeed, there was a sharp three-wave pullback from 11 624 to 8637 in the second half of 2018. The problem is that this drop is too shallow compared to the preceding impulse. Therefore, it must be just a part of a larger correction still unfolding.
Under this scenario, the selloff to 8637 in December 2018 was wave W of a bigger W-X-Y double zigzag. The recovery to 11 148 must be wave X, which also consists of only three waves. If this count is correct, wave Y down towards ~7000, possibly accompanied by a recession, is the missing piece of the puzzle.
Is There an Alternative Route for the Dow Jones Transports?
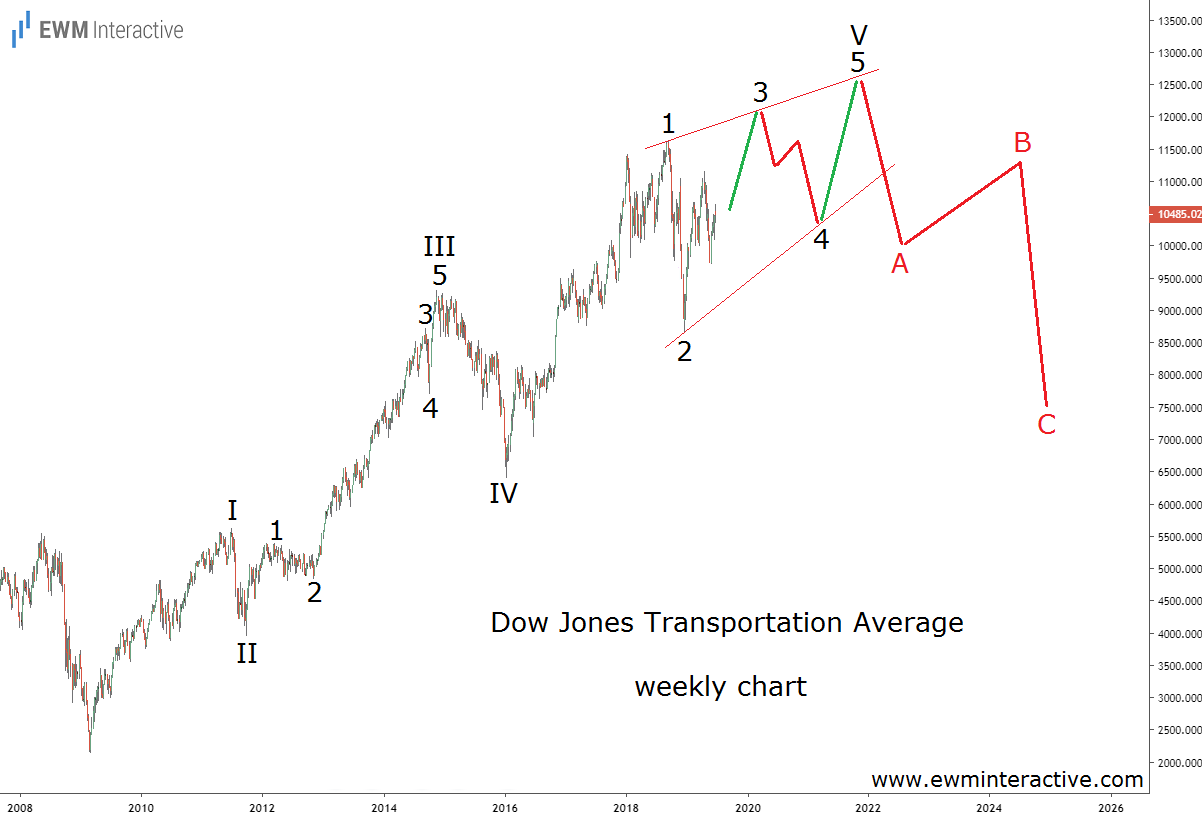
Of course, there is a chance – and not a small one – that the next episode of two consecutive quarters with negative GDP growth is at least a couple of years away. In that case, the Dow Jones Transports can easily make a new all-time high, before eventually retreating. The alternative count below shows how this can happen in terms of Elliott Wave patterns.

It might turn out wave V did not end at 11 624, but is still in progress as an ending diagonal pattern. Then the plunge to 8637 would be wave 2 of V with waves 3, 4 and 5 remaining. If the market picks this alternative, waves 3 and 5 need to reach new highs in order to complete the post-2009 recovery. Only then would the chances tilt considerably in the bears’ favor.
When will the next recession begin is anyone’s guess. It may be just around the corner or two years away. Caution is advised in both cases. The odds of experiencing another decade of uninterrupted economic growth are very low at best.
