Investing.com’s stocks of the week
One month after I last provided an update on Tesla (NASDAQ:TSLA), where I was looking for $575 to be reached, the stock dropped to as low as $537 last week and is now trading at $650s. The stock took a 40% haircut since the all-time high was struck in January. Although my downside target was reached, the way Tesla reached it was not entirely according to plan and suggested the rally off last week’s low is only a dead-cat bounce before the next leg lower starts. Well, the cat is not dead, but very much alive as it has nine lives.
Let me explain below.
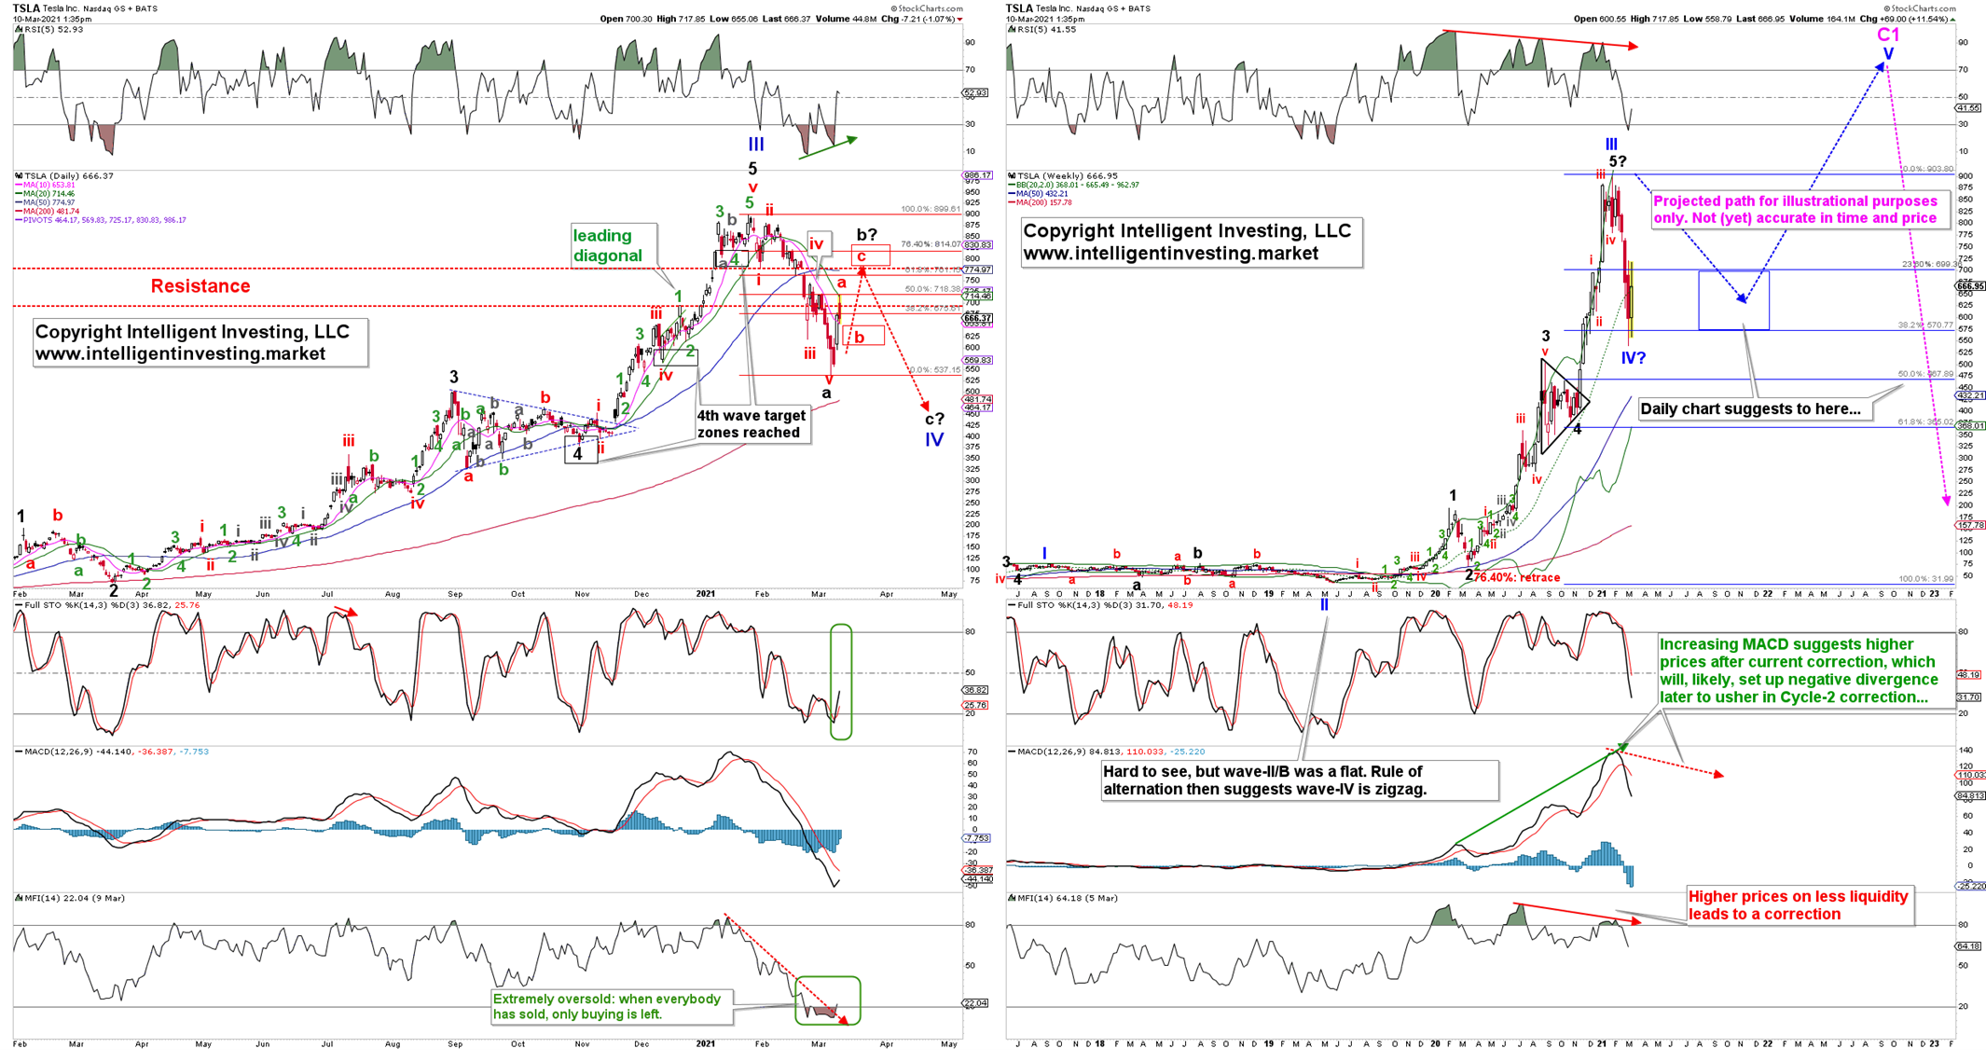
Figure 1. TSLA daily and weekly candlestick chart with EWP Count and Technical Indicators:

The daily chart shows the decline from the all-time high to last week’s low counts per the Elliott Wave Principle (EWP) best as five waves down (red i, ii, iii, iv, v). Therefore, the current rally is likely part of a larger multi-day bounce to ideally $825+/-25 before the next leg lower kicks in. Last week’s low was (black) major-a, the current “dead-cat-bounce” major-b, followed by a major-c down to ideally around $450+/-25. The overall larger pattern would then be, what is called in EWP terms a zig-zag (see here): a price-pattern made up of five waves down (major-a) completed, three waves up (major-b) under way, followed by another five waves down (major-c) to finish (blue) Primary-IV.
The three waves up are currently in progress, and the first wave has likely completed (red wave-a). The second wave is now under way (red wave-b) to ideally $625+/-25, from where the next move higher (red wave-c) should kick into ideally $825+/-25 for a typical wave-C=wave-A relationship. That targets around the 76.40% retrace of the last decline as well as into the horizontal resistance zone.
The weekly chart shows Tesla has already reached and exceeded the typical 38.20% retrace level of around $570. That suffices for a 4th wave of the (blue) primary degree. Thus, my EWP count on the daily chart could be wrong, and Tesla could already have completed the Primary-IV. A daily close above $850 will go a long way to confirm this thesis. It is, however, for now, not my preferred EWP count.
Bottom line: Regardless of Primary-IV is already complete or not, I now prefer to look higher for Tesla and reach ideally $825+/-25. From there, I expect the next decline to ideally $450+/-25. It will be confirmed on a close below the recent $537 low after $825+/-25 has been reached. Thus, from a trading perspective, one can long Tesla and raise stops accordingly as it moves towards the bounce target zone while taking partial profits along the way. If Tesla decides $537 was all of wave-IV anyway, then one has caught the right bus already and can ride it all the way higher to the low to mid-1000s.
