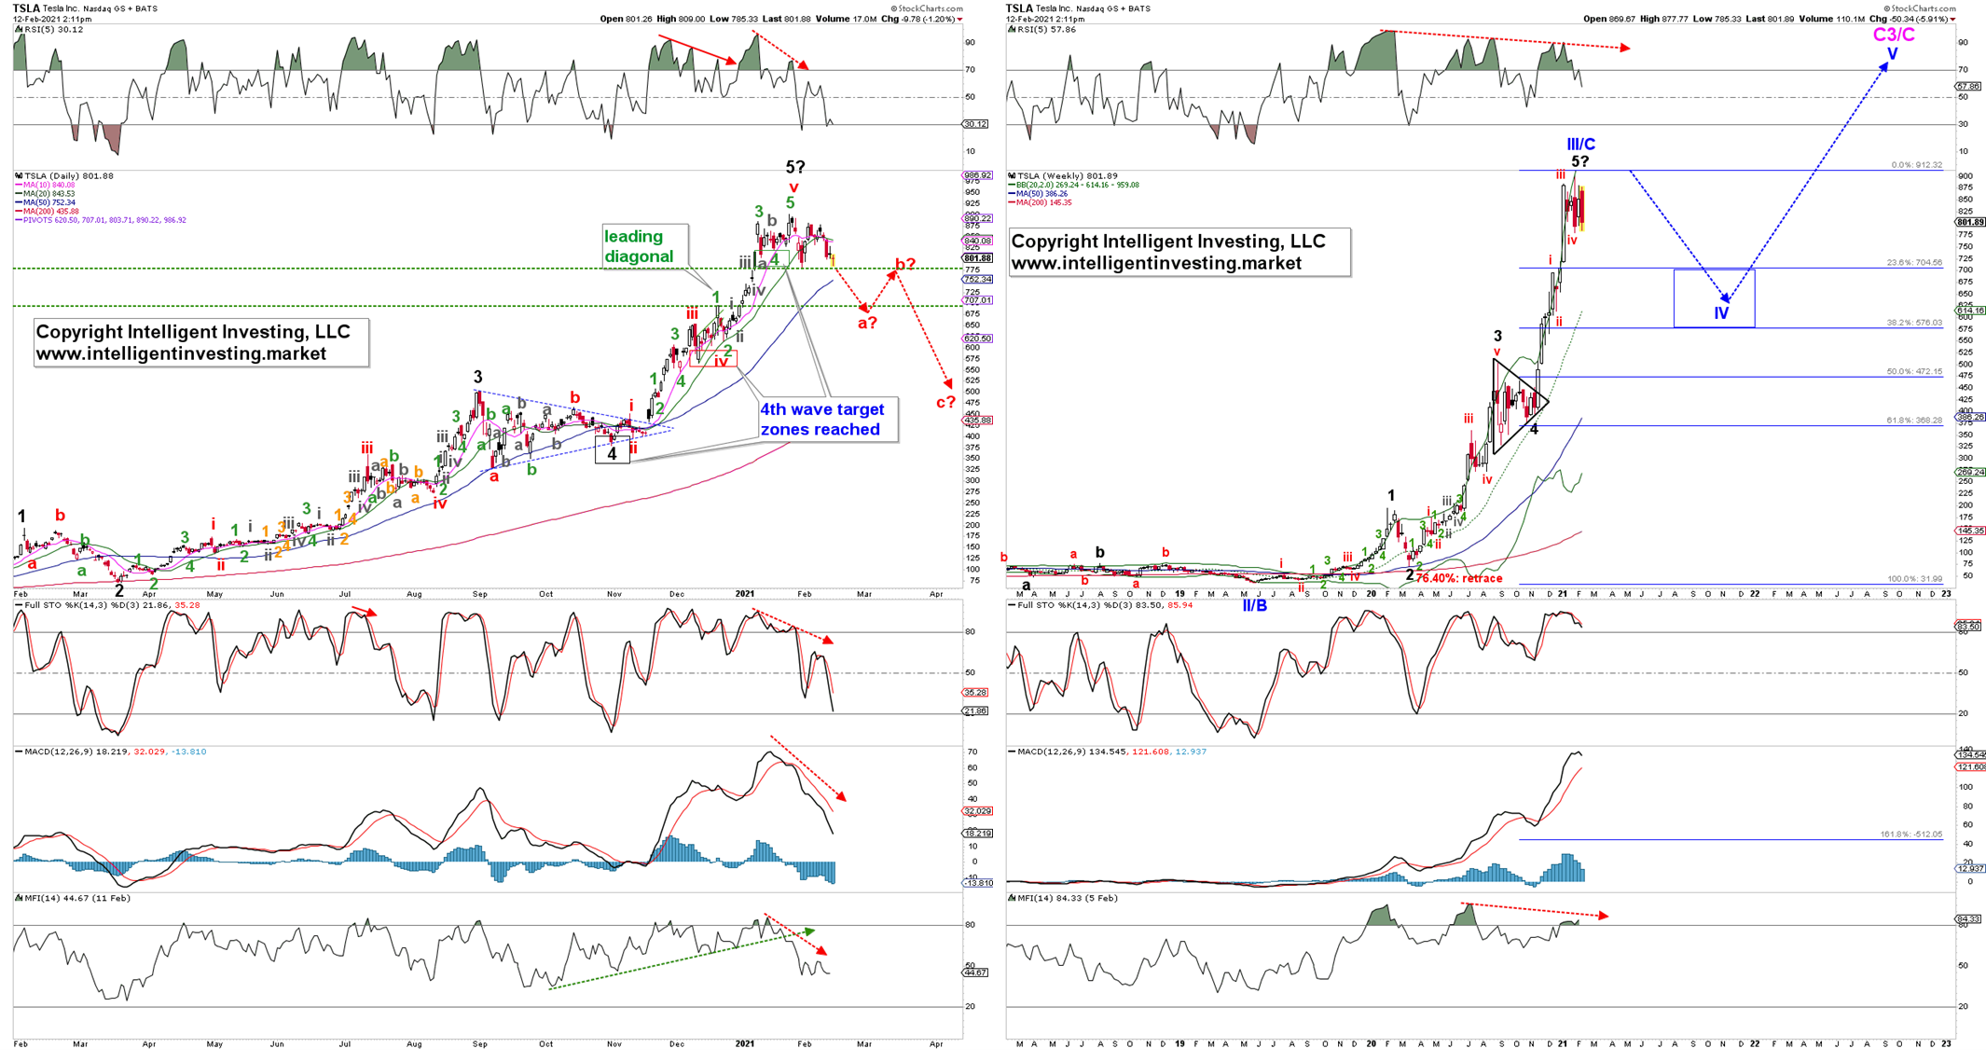
It has almost been a month since I last provided an update on high-flier Tesla Inc (NASDAQ:TSLA). Back then, Tesla was trading at around $846. Based on my Elliott Wave Principle (EWP) count and Technical Analyses (TA) combined, I found:
“TSLA [has] currently less upside reward than downside risk for the intermediate-term (weeks-months), but still has long-term potential (months+), when major-5 completes around current levels ($875-925), Primary-III completes, and Primary-IV will take center stage. … A correction of the Primary-degree is a large one, in both time and price, and suggests TLSA should see between $560-600 before primary-V to new All-time highs (ATHs) kicks in.”
Fast forward, and TSLA peaked on Jan. 24 at $900 and is now trading at around $800.
- The ideal major-5 target zone of $875-925 was reached, and the stock has lost 11% since;
- TSLA has lost 5% since my last update.
Indeed, the reward has not been great.
With another month of data in hand, I now find if TSLA loses $775+/-5 support (which was support in early- and late-January), it will likely fall back to the next support zone at $665+/-5. That would then complete a red wave-“a?”. See Figure 1 daily chart.
That level would also fit with the (blue) 23.60% retrace level, as shown in the weekly chart. When a 4th wave does a 38.20% retrace of the prior 3rd wave, it often finds support at the 23.60% retrace (red wave-a?), bounces back to previous support ($775+/-5 in this case, red wave-b?), i.e., the breakdown level, which now acts as resistance and then the next leg lower (red wave-c?) takes hold to the 38.20% retrace at $575+/-5. Thus, the daily and weekly charts align well with the anticipated pattern, support and resistance levels, and ultimate downside targets for the potential (blue) primary-IV that is now forming.
Figure 1. TSLA daily and weekly candlestick chart with EWP Count and Technical Indicators:

The caveat is 4th waves are often the most tricky of corrections and can form many patterns: zig-zags, flats, triangles, double or triple patterns, etc. See here for examples of these distinct EWP patterns. In TA terms, this would be nothing more than a consolidation pattern, aka bull flag, after a +2500% run since 2019, a 1200% run since March 2020, and a +175% run since September 2010. Thus, “some give/digestion of recent gains” is to be expected and completely normal.
Regardless, once the blue Primary IV target zone is reached, I expect the last rally, Primary-V, to new ATHs to complete a large cycle wave. After that, TSLA should see its most extensive haircut in its history.
Bottom line: In the intermediate-term (weeks) TSLA will likely be in a corrective pattern down to $700-575. Longer-term (months), TSLA will most likely still be in a bull that will reach the low to mid-1000s. But, once this bull completes, most of the gains since 2020 will probably be erased. Hence, as always, pick your trading- and investing timeframe carefully and have an exit strategy in place.
