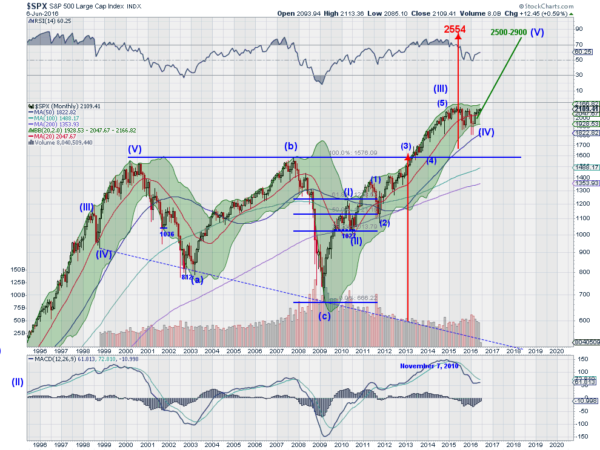
Was this year any different from the last? Who knows. For every pundit that says it is, there are plenty of others who believe just the opposite. Data gets manipulated to explain and justify whichever side you're on.
Maybe different isn't the right way to explain it. The chart above has been a rough guideline for me for almost 6 years. Of course I did not know where all the points would fall in advance. It is a living, growing beast. But the original “what if” that came out of a higher low in 2010 to a higher high has been driving it.
The break to new all-time highs in 2013 added another dimension. Not only did we see an Elliott Wave pattern that looked much higher, but also a classic triangle break pointing to the stratosphere. Along the way, momentum also joined in supporting the upside. The RSI has been in the bullish zone since then. Even the pullback in the MACD recently has held in positive territory and looks to be turning back up.
A reset for another run higher?
So what, exactly, is different? Of course it's impossible to predict what will happen next. And that fact has been the case for the fourth wave in the Elliott Wave pattern. Is it over? Does it not conform? I'm sure someone will tell me I'm wrong. But the price action will tell a different story if the S&P 500 makes a new all-time high.
At that point, I will look back and see that Wave (1) within Wave (V) has been underway since the February low. Of course this may never happen. I am open to that possibility. But a new all-time high, backed by supporting momentum after a 12 or 18 month correction opens up the real possibility of the market going much higher. Chart patterns suggest 2500 or higher.
That, my friend, is what is different this time around.

